

Overview of the Software
Table of Contents
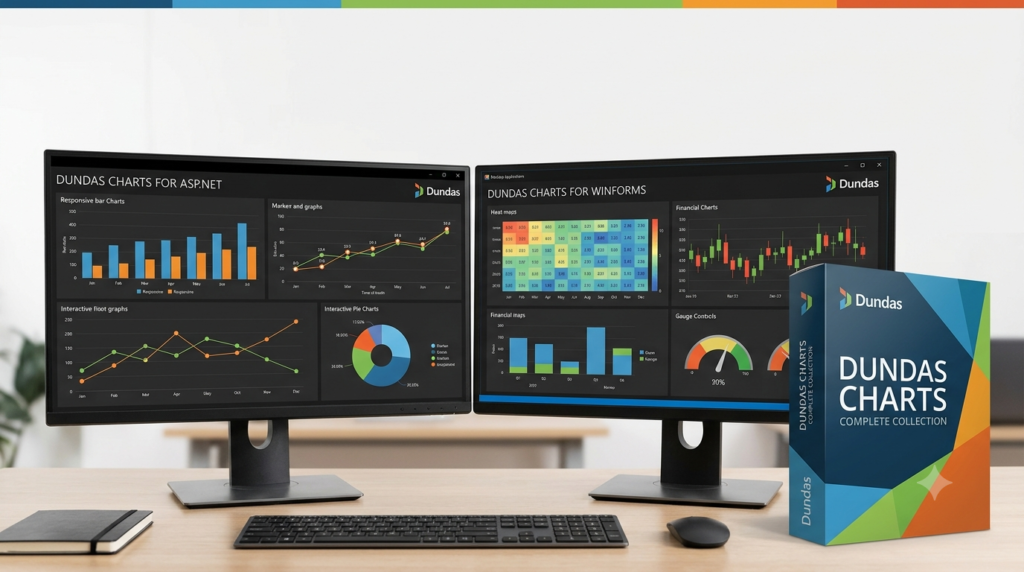
The Dundas Charts Complete Collection represents one of the most powerful and comprehensive data visualization toolkits available for Microsoft’s .NET ecosystem. This software suite provides developers with a robust set of charting and visualization components designed specifically for both ASP.NET web applications and Windows Forms desktop applications.
Dundas Data Visualization, Inc., a pioneer in the business intelligence and data visualization space, developed these components to address the growing need for sophisticated, interactive data presentation in enterprise applications . The company’s technology has been widely recognized for its quality and innovation—in fact, Microsoft acquired several of Dundas’s .NET components in 2007, incorporating them directly into the .NET Framework and SQL Server Reporting Services .
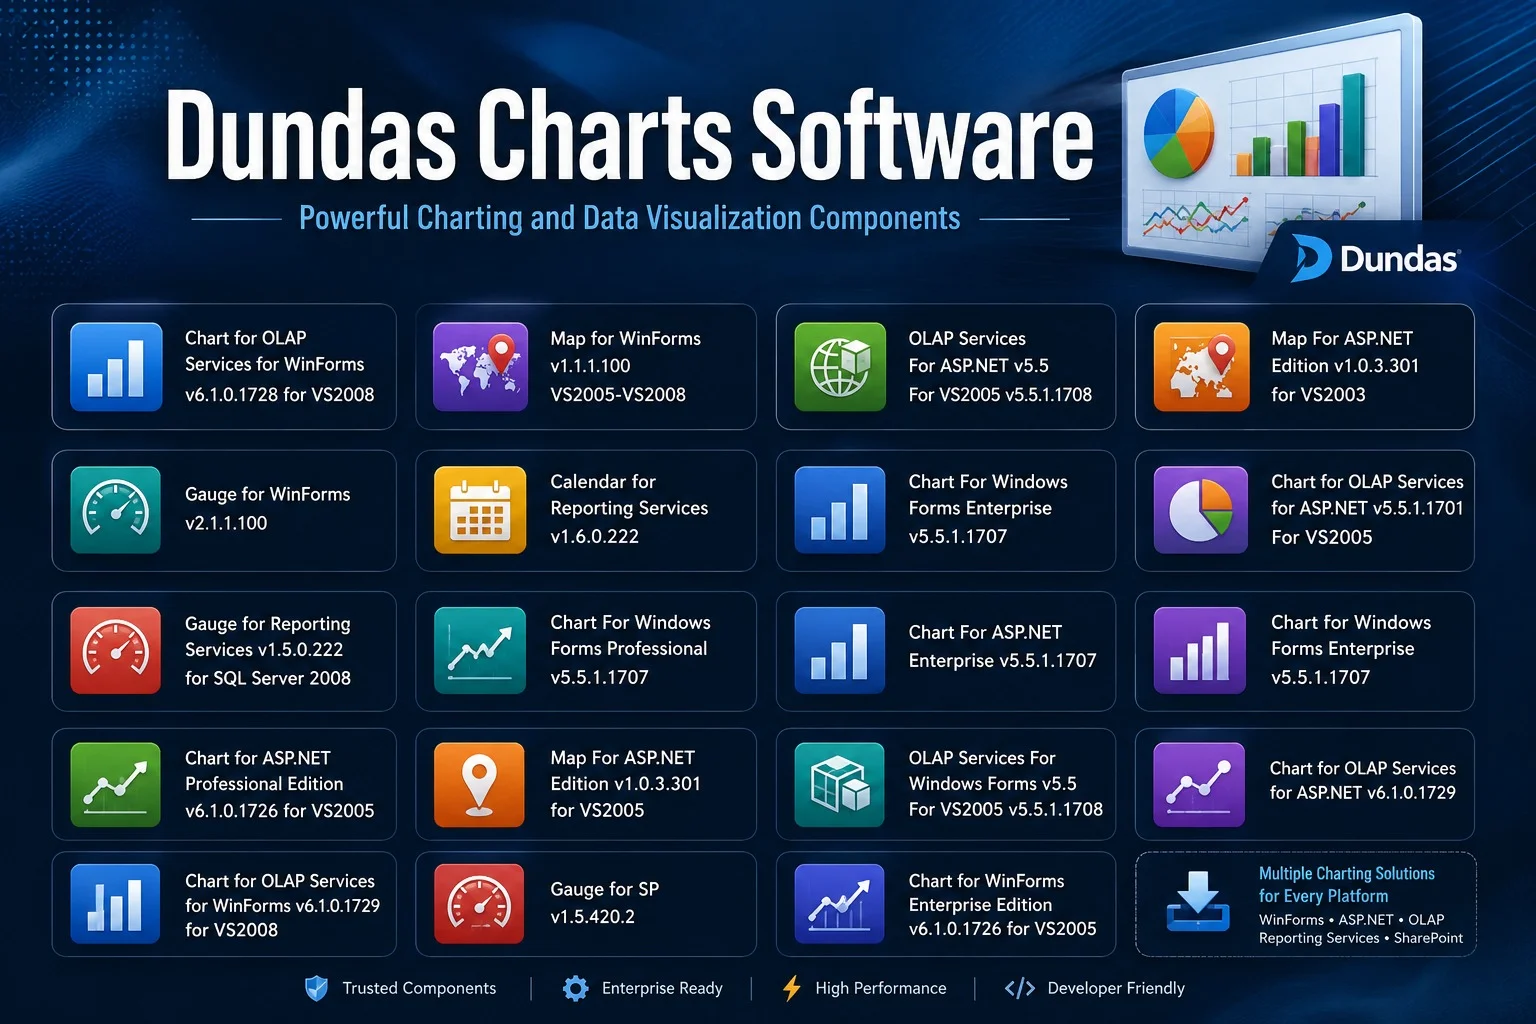
The Complete Collection packages together the full range of visualization tools that Dundas offered for the .NET platform, allowing developers to embed advanced charting, gauge, and mapping functionality directly into their applications. Whether building dynamic web dashboards or rich desktop clients, this suite delivers enterprise-grade visualization capabilities with relatively minimal development effort.
Key Features
Comprehensive Chart Types and Visualizations
The Dundas Charts Complete Collection supports an extensive array of chart types that cater to virtually any data visualization requirement :
Standard Chart Types:
-
Line and Area Charts – Classic visualizations for trend analysis, including curved variations for smoother data representation
-
Bar and Column Charts – Including stacked and 100% stacked variations for comparative analysis
-
Pie and Donut Charts – Ideal for proportional data display
-
Point and Bubble Charts – Perfect for scatter plot analysis and correlation visualization
Specialized Chart Types:
-
Candlestick and Stock Charts – Essential for financial data analysis, showing high, low, open, and close values
-
Box Plot (Box-and-Whisker) Charts – Statistical visualizations for data distribution analysis
-
Range Charts – Displaying data between two values, useful for project scheduling (Gantt-like charts)
-
Radar Charts – For multivariate comparison in a circular format, available in area, line, point, and range variants
-
Waterfall Charts – Understanding cumulative effects and variance analysis
Advanced Visualizations:
-
Heat Maps – Color-based data representation for density and distribution analysis
-
Treemaps – Hierarchical data visualization using nested rectangles
-
Sankey Diagrams and Relationship Diagrams – Flow and connection visualization
-
Sunburst Charts – Radial hierarchical visualization
-
Funnel Charts – Ideal for pipeline and conversion analysis
The breadth of available visualizations enables developers to choose the optimal presentation method for their specific data storytelling requirements, from simple line charts to complex, multi-dimensional visual analytics.
Dual Platform Support: ASP.NET and Windows Forms
One of the defining characteristics of the Complete Collection is its support for both major .NET development paradigms:
ASP.NET Integration: ASP.NET is Microsoft’s open-source web development framework for building dynamic websites, web applications, and web services . It is part of the broader .NET platform and offers features including:
-
Model-View-Controller (MVC) architecture support for organized code development
-
RESTful API creation capabilities
-
Built-in security features including authentication and authorization
-
High-performance request handling through asynchronous programming
The Dundas Charts components integrate seamlessly with ASP.NET, enabling developers to add professional-grade charting to web applications with minimal additional code.
Windows Forms Integration: Windows Forms is a UI framework for building rich desktop client applications for Windows . It provides:
-
A drag-and-drop visual designer in Visual Studio
-
A comprehensive set of UI controls (text boxes, buttons, dropdowns, etc.)
-
Event-driven programming model
-
Access to local hardware and file systems
-
Support for data binding and graphics rendering
The Chart controls for Windows Forms inherit the same visual design capabilities, allowing desktop applications to leverage sophisticated data visualization while maintaining platform-specific interaction patterns.
Robust Data Binding and Manipulation
The Complete Collection excels in its data handling capabilities:
-
Flexible Data Sources: Connect directly to various data sources including databases, XML, JSON files, web services, and in-memory objects
-
Data Binding: Seamlessly integrate data from any BindingSource component, enabling dynamic visualization updates
-
Data Transformation: Sort, filter, and group data before rendering
-
Real-time Updates: Support for live data streaming and dynamic chart updates
-
Interactive Features: Drill-down, panning, zooming, and tooltip functionality
Customization and Styling
The toolkit provides extensive customization options:
-
Complete Control Over Appearance: Modify colors, fonts, labels, legends, and axes
-
Conditional Formatting: Apply colors to data points or series based on values using color rules
-
Custom Rendering: Extend and override default rendering behaviors
-
Interactive Elements: Add click, hover, and selection events to data points
Export and Printing Capabilities
Export visualizations to multiple formats for sharing and reporting:
-
Image formats (PNG, JPG, BMP, GIF)
-
Vector formats (SVG, EMF) for high-quality printing
-
Excel and PDF export capabilities
-
Interactive HTML export preserving chart interactivity
What’s New in the Latest Version
As part of the evolution of Dundas technology, the visualization components have been continuously enhanced. Following Dundas’s acquisition by insightsoftware in 2022, the company’s technology now forms a core part of Logi Symphony, a unified embedded analytics platform . The Complete Collection components continue to be valuable for:
-
Modern .NET Support: Ongoing compatibility with .NET Framework 4.x, Visual Studio 2022, 2019, and 2017
-
Improved Performance: Optimized rendering for large datasets
-
Enhanced Interactivity: More sophisticated interactive features in modern web applications
-
Cross-Platform Compatibility: Through ASP.NET Core, applications can now run on Windows, macOS, and Linux
System Requirements
ASP.NET Development
-
Operating System: Windows Server, Windows 7/8/10/11, or compatible platform
-
Framework: .NET Framework 4.x or .NET Core/5+/6/7/8/9
-
Web Server: Microsoft IIS (Internet Information Services)
-
Development Environment: Visual Studio 2022, 2019, or 2017
-
Browser: Modern browsers supporting HTML5
Windows Forms Development
-
Operating System: Windows 7/8/10/11
-
Framework: .NET Framework 4.x or .NET 6/7/8/9
-
Development Environment: Visual Studio 2022, 2019, or 2017
-
Minimum RAM: 1 GB (2+ GB recommended)
-
Disk Space: 100 MB for installation
Installation Guide
Step 1: Licensing and Acquiring the Software
Acquire a valid license for the Dundas Charts Complete Collection through authorized channels. Licenses are typically available through subscription models or perpetual licenses, depending on the agreement with the vendor.
Step 2: Prerequisites
Before installation, ensure your environment is configured:
-
Install the appropriate version of Visual Studio (2022, 2019, or 2017)
-
Confirm the target .NET Framework version is installed
-
For web development, ensure IIS is properly configured with ASP.NET support
Step 3: Running the Installer
-
Execute the installation package for the Complete Collection
-
Follow the on-screen prompts to select installation options
-
Choose the components to install (ASP.NET, WinForms, or both)
-
Accept the license agreement
Step 4: Adding Controls to the Toolbox
For Windows Forms:
-
Open your project in Visual Studio
-
Right-click the Toolbox and select “Choose Items…”
-
Navigate to the “.NET Framework Components” tab
-
Locate and check the Dundas Chart and related controls
-
Click OK to add them to your toolbox
For ASP.NET:
-
The controls are typically added through the project references
-
Verify the Dundas assemblies are referenced in your web project
Step 5: Licensing Activation
-
Navigate to the licensing dialog or use the provided license key
-
Enter the license key and complete activation
-
Verify activation through the chart control’s properties
Step 6: Validate Installation
Create a test project and add a simple chart control to verify functionality:
-
Drag a Chart control onto a form or page
-
Add a series and bind it to sample data
-
Run the application to verify the chart renders correctly
How to Use the Software
Getting Started with a Basic Chart
Basic Steps:
-
Add the Chart Control: Drag the Chart control from the toolbox onto your form or web page
-
Set Up Data: Define the data source (database, XML, web service, or in-memory data)
-
Configure Series: Add one or more series to the chart
-
Choose Chart Type: Select the appropriate chart type from the comprehensive list
-
Bind Data: Connect the data to your chart using the DataBinding properties
-
Customize Appearance: Adjust colors, labels, legend, axes, and other visual elements
Creating Advanced Visualizations
Example: Box-and-Whisker Plot
Box plots are ideal for showing data distribution . To create:
-
Select the BOX_PLOT chart type
-
Configure your data with minimum, first quartile, median, third quartile, and maximum values
-
Optionally add outlier indicators
-
Customize whisker calculations and styling
Example: Waterfall Chart
Waterfall charts are excellent for financial analysis and variance tracking:
-
Select the WATERFALL chart type
-
Configure series to show cumulative changes
-
Define which data points represent subtotals or totals
Example: Range Bar (Gantt-like) Chart
Project scheduling and timeline visualization:
-
Select the RANGE_BAR chart type
-
Provide start and end values for each task
-
Customize axis labeling for time scales
Data Binding in ASP.NET
ASP.NET applications leverage the framework’s data capabilities :
-
Code-Behind Data Binding: Use server-side code to populate chart data
-
Data Source Controls: Utilize SqlDataSource, ObjectDataSource, or Entity Framework
-
Dynamic Queries: Build data queries programmatically for flexible reporting
Data Binding in Windows Forms
Windows Forms applications benefit from the visual designer and data binding features:
-
Designer Data Binding: Use the Data Sources window to drag items onto charts
-
Runtime Binding: Set data sources programmatically
-
BindingNavigator: Enable user navigation through records
Best Use Cases
Enterprise Business Intelligence Dashboards
The Complete Collection excels in BI scenarios:
-
Executive Dashboards: Summarizing KPIs and metrics
-
Performance Monitoring: Real-time operational dashboards
-
Sales Analytics: Pipeline analysis, territory performance, and forecasting
-
Financial Reporting: P&L, balance sheet, and cash flow visualization
Financial and Trading Applications
Specialized chart types support financial analysis:
-
Candlestick Charts: For stock price analysis
-
Technical Indicators: Customizable financial indicators
-
Forex and Cryptocurrency: Real-time trading data visualization
-
Risk Analysis: Portfolio performance tracking
Healthcare and Life Sciences
Data-intensive applications benefit from visualization:
-
Clinical Trial Analysis: Statistical analysis and outcome visualization
-
Patient Monitoring: Vital signs and health metrics dashboards
-
Research Data Exploration: Complex data relationship exploration
-
Medical Imaging Integration: Support for custom visual renderings
Manufacturing and Supply Chain
-
Production Monitoring: Real-time manufacturing metrics
-
Quality Control: Statistical process control and defect analysis
-
Inventory Management: Stock levels and supply chain metrics
-
Logistics Visualization: Transport and delivery tracking
Scientific and Research Applications
-
Scientific Data Visualization: Complex multi-dimensional data display
-
Geospatial Analysis: Map visualization capabilities
-
Statistical Analysis: Box plots, histograms, and scatter plots
Advantages and Limitations
Advantages
Extensive Chart Library
The Complete Collection offers over 20 distinct chart types with multiple variations, covering practically every visualization scenario . This breadth reduces the need for custom chart development.
Platform Consistency
Developers can use the same familiar components for both ASP.NET and Windows Forms, maintaining consistency across web and desktop applications and reducing the learning curve.
Professional-Grade Visual Quality
Dundas charts have a polished, professional appearance that enhances the visual appeal of applications and user confidence in the data presented.
Performance for Large Datasets
Optimized rendering ensures charts remain responsive even with large datasets, with support for data aggregation and automatic performance optimization.
Comprehensive Documentation
Access to detailed API documentation, how-to guides, and support resources facilitates rapid implementation .
Interactive Capabilities
Built-in interactivity features (drill-down, tooltips, zooming) enhance user engagement and data exploration.
Export and Reporting
Flexible export options support multiple formats for sharing insights.
Limitations
Licensing Cost
As a premium enterprise toolkit, licensing costs can be significant, particularly for smaller organizations.
Platform Constraints
Windows-only development environment limitations for legacy .NET Framework versions, though modern .NET Core supports cross-platform deployment.
Learning Curve for Advanced Features
While basic charts are straightforward, advanced visualizations and customizations require time to master.
Component Weight
Full assembly footprint may impact application load times in some scenarios.
Alternatives to the Software
Free/Open Source Options
Microsoft Chart Controls
-
Integrated with .NET Framework
-
Free to use with Visual Studio
-
Limited advanced functionality compared to Dundas
Chart.js
-
Web-based JavaScript library
-
Open source with extensive community support
-
Excellent for web applications but limited .NET integration
OxyPlot
-
Cross-platform plotting library for .NET
-
Open source with good performance
-
More limited chart type selection
ScottPlot
-
Free plotting library for .NET
-
Good for simple to moderate complexity charts
-
Less enterprise-focused
Commercial Alternatives
Telerik UI for ASP.NET and WinForms
-
Broad collection of UI controls including charting
-
Modern design and active development
-
Strong vendor support and documentation
DevExpress Chart Control
-
Comprehensive charting suite
-
Excellent design time experience
-
Part of larger UI component library
Syncfusion Essential Studio
-
Extensive charting capabilities
-
All-in-one component suite
-
Competitive pricing model
ComponentOne Charts
-
Robust visualization options
-
Good performance with large datasets
-
Strong enterprise features
Highcharts
-
Premium JavaScript charting library
-
Excellent for web applications
-
Wide range of interactive chart types
Frequently Asked Questions
General Questions
Q: Is this software free? What are the licensing options?
The software is commercial. Licensing typically requires purchasing a subscription or perpetual license. Free trials are available for evaluation. For pricing and licensing details, contact the vendor directly.
Q: What is the difference between the Complete Collection and the standard edition?
The Complete Collection includes all visualization components including charting, gauges, and mapping capabilities, whereas standard editions may offer only charting. The Complete Collection also typically includes both ASP.NET and Windows Forms components.
Technical Questions
Q: Can I use Dundas Charts on Linux or macOS?
Yes, if using ASP.NET Core with modern .NET versions. The web-based components can be deployed to cross-platform environments .
Q: Does it support interactive data visualization with drill-down capabilities?
Yes, drill-down functionality is supported. This allows users to click on chart elements to navigate to more detailed views, making it highly effective for BI and analytical applications.
Q: Can it display real-time data or handle live streaming?
Yes, the components support real-time data updates and live streaming, making them suitable for monitoring dashboards and real-time analytics applications.
Q: What data formats does it support?
The toolkit supports various data sources including databases (via ADO.NET), XML, JSON, web services, and in-memory objects. Essentially any data source accessible from .NET can be used.
Q: How does it integrate with SQL Server Reporting Services (SSRS)?
Dundas components can be integrated with SSRS, providing enhanced visualization capabilities beyond the built-in SSRS charting options.
Q: What’s the difference between using this and built-in Microsoft Chart Controls?
Dundas Charts offer more advanced features, a wider range of chart types, superior performance for large datasets, and more extensive customization options. Some Dundas technology was even acquired by Microsoft and incorporated into .NET Framework components.
Q: Can I print charts or export them to other formats?
Yes, the toolkit supports exporting to multiple formats including PNG, JPG, BMP, GIF, SVG, EMF, Excel, and PDF.
Platform-Specific Questions
Q: Does it support both ASP.NET Web Forms and ASP.NET MVC?
Yes, the components work with both ASP.NET Web Forms and ASP.NET MVC, as well as ASP.NET Core for modern cross-platform applications.
Q: Can I use it with Visual Studio 2022?
Yes, Visual Studio 2022 is fully supported for both ASP.NET and Windows Forms development.
Q: Is there a cross-platform version for desktop applications?
For desktop, Windows Forms components are primarily Windows-only. However, for web applications, ASP.NET Core enables cross-platform deployment.
Q: What are the differences in functionality between the ASP.NET and Windows Forms versions?
Both versions share core charting functionality, with platform-specific optimizations. Windows Forms versions leverage the Visual Studio designer more deeply, while ASP.NET versions include web-specific features like client-side interactivity.
Q: Can I build mobile applications with Dundas Charts?
While the primary focus is desktop and web, the ASP.NET components can be used in responsive web applications and accessed from mobile browsers.
Final Thoughts
The Dundas Charts Complete Collection for ASP.NET and WinForms stands as a premier data visualization solution for the .NET ecosystem. Its comprehensive chart library, powerful customization capabilities, and robust data binding make it an invaluable tool for developers building enterprise applications that require sophisticated data presentation.
When compared to alternatives, the Complete Collection strikes a compelling balance between features, performance, and professional polish. Whether you’re developing financial dashboards, scientific analysis tools, or manufacturing monitoring applications, this toolkit provides the visual components needed to create compelling, interactive data visualizations that drive business insights.
For organizations requiring enterprise-grade visualization with the backing of professional support and regular updates, the Dundas Charts Complete Collection represents a solid investment in application development infrastructure. The software’s enduring presence in the .NET visualization landscape, including Microsoft’s incorporation of Dundas technology into .NET Framework components, validates its quality and reliability.
The transition of Dundas technology into insightsoftware’s Logi Symphony platform suggests continued evolution and support, ensuring that developers can rely on these visualization components for years to come. For developers and organizations committed to building high-quality, data-rich applications on the Microsoft platform, the Dundas Charts Complete Collection remains a powerful and versatile choice.