
Overview of the Software
Table of Contents
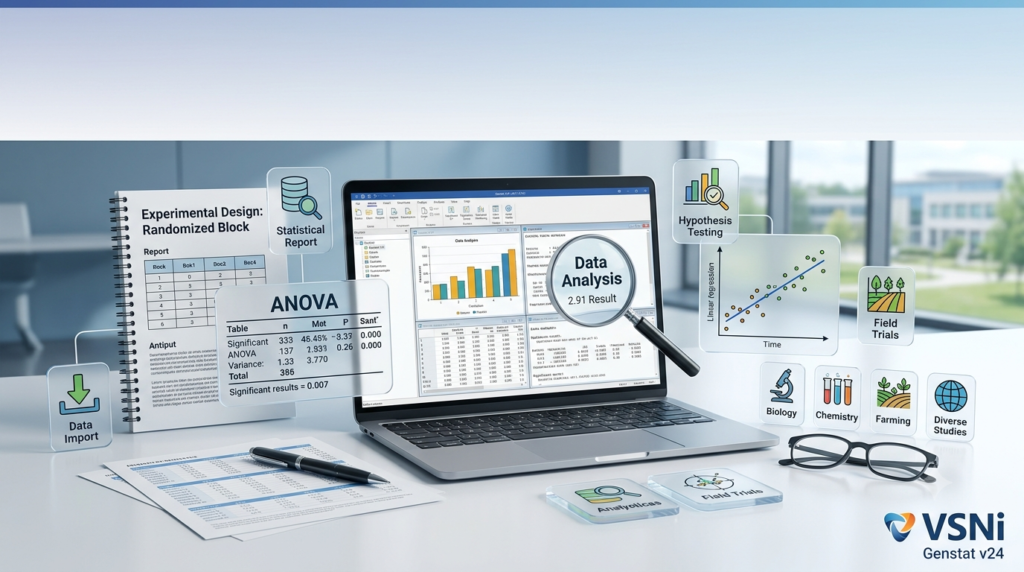
Genstat is a robust data analysis tool developed by VSNi, designed to deliver reliable insights for informed decision-making across various research fields. It provides a flexible environment where both technical and non-technical users can undertake everything from basic statistical tests to sophisticated analytical challenges.
The software’s interface is built around an intuitive menu system that guides users through analytical workflows. For more advanced applications, Genstat includes a powerful programming language that allows researchers to develop custom techniques and conduct complex experiments. The platform supports a wide range of data procedures, comprehensive data management facilities, and dynamic graphical capabilities.
Genstat is particularly distinguished by its leading ANOVA and REML (Residual Maximum Likelihood) engines, which ensure trustworthy results even for the most intricate research questions. The software is used extensively in agricultural research, food science, soil science, and breeding programs across academia and industry.
Key Features
Statistical Analysis Suite
Genstat provides an extensive array of statistical methods, covering foundational and advanced techniques:
-
Analysis of Variance (ANOVA): Powerful models for comparing treatment means are widely used in agronomic research, food science, and six-sigma quality improvement processes.
-
Mixed Models (REML): Essential for analyzing data with complex hierarchical structures, common in plant and animal breeding trials.
-
Multivariate Analysis: Methods including principal components analysis, cluster analysis, and canonical correlation analysis for uncovering patterns in complex datasets.
-
Non-parametric Tests: A wide range of tests, such as the Wilcoxon signed rank test, Kruskal-Wallis test, and Spearman correlation test.
-
Data Mining: Techniques like support vector machines, regression trees, random regression forests, and neural networks for making predictions from large datasets.
Experimental Design
Genstat’s capabilities for generating and analyzing experimental designs are a core strength. Users can create standard designs with increased factor capacities and analyze designs using specialized models.
Data Management and Visualization
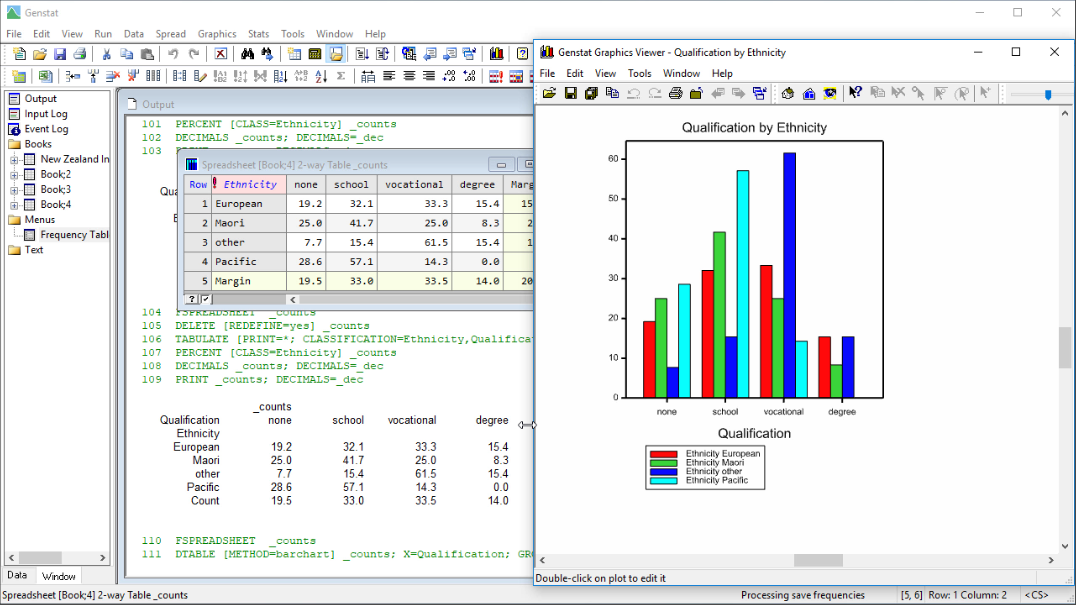
The software includes robust spreadsheet facilities for data storage and manipulation. Data can be easily imported from diverse sources and prepared for analysis using efficient tools. A wide range of graphical options allows users to visualize data and identify insights, with the latest version including new plot types and enhanced customization.
What’s New in the Latest Version
Version 24.1.0.242 introduces several significant enhancements across the statistical menus, graphics environment, and spreadsheet tools.
Statistics Enhancements
-
New Analysis with Censoring: New menus have been added for Analysis of Variance with Censoring, Generalized Linear Models with Censoring, and Interval Censored Analysis, expanding the software’s capability to handle survival and reliability data.
-
2D Spline Analysis: A new menu for 2D Spline Analysis of Row-Column Design fits advanced LVIS and SpATS models, useful for spatial analysis in field trials.
-
Expanded Design Options: The Analysis of Variance and Generate a Standard Design menus now include a Split-Split-Split-Plot Design type, and the maximum number of factors in some designs has been increased.
-
Trials Menu: A new optional menu for a variety trial pipeline is available, which can be enabled in the options menu.
Graphics Enhancements
-
New Heatmap Plot: A dedicated menu for creating heatmaps allows users to plot a variate as a colour spectrum on a grid.
-
Improved Defaults: Default symbols and colours have been updated for better visual clarity. Users can revert to legacy settings if preferred.
-
Enhanced Customization: Users can now control line thicknesses, define custom colour palettes, and set text sizes and fonts across all graphics menus.
-
Plot Upgrades: The 1D Density/Violin Plot has new features to add pirate plot elements, the Boxplot menu can now colour boxes, and the Mosaic Plot menu includes options for axis titles and better factor display control.
Spreadsheet and General Enhancements
-
Lagged Values/Differences: A new menu creates lagged values or differences from columns, simplifying time-series data preparation.
-
Increased Merge Keys: The Merge Spreadsheet dialog now supports up to six merge keys, up from four.
-
Column Management: Users can now rename multiple columns at once via a new dialog accessed from the Row column heading.
-
Enhanced Find: The ability to bookmark all incidents of a string has been added to the Find dialog.
-
Updated Functions: The Calculations and Probability Calculations menus have been updated with new functions added since the 15th edition.
-
Additional Datasets: 365 new agricultural datasets have been added to the example data sets menu.
-
Biometris Library: The Biometris Procedure library is now distributed with Genstat and can be installed directly from the menu.
System Requirements
Based on the available platform information:
| Component | Requirement |
|---|---|
| Operating System | Windows 7 / Windows 10 |
| Architecture | Compatible with 64-bit systems |
| Internet Connection | Required for software updates and online services |
| Storage | Space for installation and datasets |
| RAM | Sufficient memory for large dataset analysis |
Note: For the most up-to-date and detailed system requirements, please consult the official VSNi website or the software’s installation documentation.
Installation Guide
The installation process for Genstat is typically straightforward. Follow these general steps:
-
Obtain the Software: Download the official Genstat installer from the VSNi website. A valid license is required for use.
-
Run the Installer: Launch the downloaded installer executable file.
-
Select Language: Choose your preferred language for the installation process if prompted.
-
License Agreement: Read and accept the End User License Agreement (EULA).
-
Choose Installation Directory: Select the destination folder where you want to install Genstat, or accept the default path.
-
Customize Installation (Optional): Some installers may allow you to select which components to install.
-
Start the Installation: Click the “Install” button to begin the copying of files. Wait for the process to complete.
-
Finish and License: Once complete, launch Genstat and enter your license information to activate the software.
How to Use the Software
Getting Started with Genstat
Genstat’s user interface is designed to be intuitive, guiding users through the analytical process.
-
Data Input: Begin by entering your data into the spreadsheet. Data can be typed directly, copied from other applications, or imported from various file formats.
-
Select an Analysis: Navigate the comprehensive menus to find the statistical method you need. The menus are organized by analytical task (e.g., Statistics → Analysis of Variance).
-
Configure the Analysis: In the analysis dialog, specify the variables (columns) you want to analyze. Define the model structure (e.g., factors, covariates, interactions). The software often includes helpful defaults to guide you.
-
Run the Analysis: Click the “Run” button. Genstat will execute the analysis and display the results in an output window.
-
Interpret Output: Review the output, which includes tables of results, model summaries, and significance tests. Copy or export results as needed.
-
Graphical Exploration: Use the Graphics menu to create plots from your data or analysis results. The graphics viewer allows interaction and editing of plots.
Working with Experimental Designs
A key strength of Genstat is its ability to both generate and analyze experimental designs.
-
Generating Designs: Use the Design menu to create randomized complete block designs, split-plot designs, and other standard layouts. Version 24.1 has expanded these options.
-
Analyzing Designs: For designs with complex error structures, such as those common in field trials, use the REML (Mixed Model) analysis menu. This allows you to fit models that account for multiple sources of variation and spatial correlation.
Best Use Cases
Agricultural and Agronomic Research
Genstat is a cornerstone tool for agricultural scientists. It is used for analyzing variety trials, optimizing fertilizer application, and understanding the impact of environmental factors on crop yield. The new 2D Spline Analysis of Row-Column Design menu is particularly useful for analyzing large field trials with spatial variation.
Food Science and Quality Control
In the food industry, Genstat’s ANOVA and six-sigma statistical tools (including control charts) are used to identify variations or defects in processes, leading to quality improvements. Researchers use it to test hypotheses about product formulations and processing methods.
Plant and Animal Breeding
VSNi’s software, including Genstat, is specifically designed for the complexities of breeding data. Breeders use it to predict breeding values, analyze pedigree data, and perform genomic selection, accelerating genetic gain in breeding programs.
Soil Science
Researchers use Genstat to analyze soil data from efficiently designed experiments. Methods like multivariate analysis help uncover patterns in soil properties, while data mining techniques can build predictive models for soil behavior under different conditions.
Advantages and Limitations
Advantages
| Benefit | Description |
|---|---|
| Trustworthy Analytics | Leading ANOVA and REML engines ensure reliable results for complex research questions. |
| Comprehensive Toolset | Covers everything from basic t-tests to advanced mixed models, multivariate analysis, and data mining. |
| Intuitive Interface | Menu-driven design guides users, making powerful statistical methods accessible. |
| Flexibility | A powerful programming language allows for custom analyses and automation. |
| Sector-Specific | Features and menus, such as the new Trials menu, are tailored to specific research fields like agriculture and breeding. |
| Data Integration | Excellent data management capabilities, including importing data from diverse sources and spreadsheet facilities. |
Limitations
| Drawback | Description |
|---|---|
| Statistical Knowledge | Requires a certain level of statistical understanding to use effectively and interpret results correctly. |
| Cost | As a premium, specialized tool, it may be prohibitively expensive for individuals or small organizations without dedicated research budgets. |
| Specialized Focus | While flexible, it is not a general-purpose business intelligence tool. It is optimized for scientific research and analysis. |
Alternatives to the Software
While Genstat is a powerful and specialized tool, several alternatives exist depending on the user’s needs and budget:
-
R: A free, open-source programming language and environment for statistical computing and graphics. It is highly extensible via packages, offering unparalleled flexibility for custom analysis. Requires programming skills.
-
SAS: A comprehensive commercial software suite for advanced analytics, multivariate analysis, business intelligence, and data management. Widely used in large enterprises and clinical research.
-
SPSS: A popular commercial statistical software with a point-and-click interface, making it accessible to users with less programming background. Strong in social science research.
-
JMP: A commercial statistical discovery software from SAS. It emphasizes interactive and visual analysis, bridging the gap between data exploration and statistical modeling.
-
Python (with Pandas, NumPy, SciPy, Statsmodels): A free, open-source programming language that has become a dominant force in data science and analysis. Offers extensive libraries for data manipulation and statistical modeling, but also requires programming skills.
Frequently Asked Questions
What is Genstat used for?
Genstat is a statistical software package used for data analysis, experimental design, and predictive modeling. It is widely used by researchers in agriculture, food science, biology, and related fields for tasks ranging from basic ANOVA to complex mixed models and data mining.
What is the new version of Genstat?
The latest version discussed is Genstat 24th Edition, which includes Release 24.1. This update introduces new features like ANOVA with Censoring, 2D Spline Analysis, and a Heatmap Plot menu, among many other enhancements.
Is Genstat difficult to learn?
Genstat is designed to be user-friendly, especially for researchers familiar with statistical concepts. The menu-driven interface guides users through many analyses, making complex methods more accessible. For custom programming, a steeper learning curve exists, which is typical for such powerful software.
Who develops Genstat?
Genstat is developed and maintained by VSNi (VSN International), a company specializing in data analysis software and consultancy for the biosciences and breeding sectors.
What are the system requirements for Genstat?
The software is compatible with Windows operating systems, with reported support for Windows 7 and Windows 10. For the most accurate and current system requirements, it is best to consult the official VSNi website.
Can Genstat be used for commercial breeding programs?
Yes, it is a key tool for commercial breeders in agriculture, aquaculture, and forestry. It is used for analyzing large and complex datasets to predict breeding values, manage genetic programs, and accelerate genetic gain.
What’s new in Genstat 24.1.0.242?
Key updates include new menus for censored data analysis, a 2D Spline Analysis menu for field trial designs, a Heatmap Plot, enhanced graphics customization, and a new optional Trials menu. The spreadsheet capabilities and function libraries have also been expanded.
How does Genstat compare to R?
Genstat offers a comprehensive, menu-driven interface that is often easier for non-programmers to use for standard analyses. R provides a free, open-source environment that is highly extensible through packages but requires programming skills. Genstat is often chosen for its user-friendly, specialized tools in sectors like agriculture and breeding.
Final Thoughts
VSNi Genstat v24.1.0.242 remains a leading solution for researchers requiring reliable, powerful, and user-friendly statistical analysis tools. The latest update demonstrates VSNi’s commitment to its user base by adding modern analytical techniques—like censored data analysis and spatial models—and enhancing the overall user experience with improved graphics and data management features.
While it requires a certain level of statistical knowledge and a financial investment, its specialized focus on the biosciences and breeding sectors, combined with its trusted analytical engines, makes it an indispensable tool for its core audience. For researchers in agriculture, food science, and related fields, Genstat provides the confidence and insight needed to turn complex data into informed decisions.
Our Paid Service
“We do not sell or provide any software. We only offer professional support services. If any software on your system is not working properly, or you are facing installation errors, crashes, or any other technical issue — just contact us. We will help you fix the problem quickly and remotely via AnyDesk. No software will be provided from our side — only expert troubleshooting and support.”