

Overview of Bookmap Software
Table of Contents
Bookmap is a professional trading platform that specializes in order flow analysis and market microstructure visualization. Unlike traditional charting platforms that focus on price movement outcomes, Bookmap reveals the underlying mechanics of market behavior by displaying real-time liquidity, absorption patterns, and participant aggression across multiple price levels . The software aggregates market data from various exchanges and presents it through an intuitive heatmap interface that color-codes bid and ask volume, making it immediately apparent where buying and selling pressure concentrates.
The platform serves traders across multiple asset classes including futures, equities, cryptocurrencies, and forex. Bookmap’s unique value proposition lies in its ability to show traders what’s happening beneath the surface of price action, exposing hidden liquidity and institutional order flow that standard candlestick charts completely obscure. Version 7.6.0 builds upon this foundation with enhanced performance, expanded market connectivity, and refined analytical tools.
Key Features of Bookmap 7.6.0
Heatmap Visualization
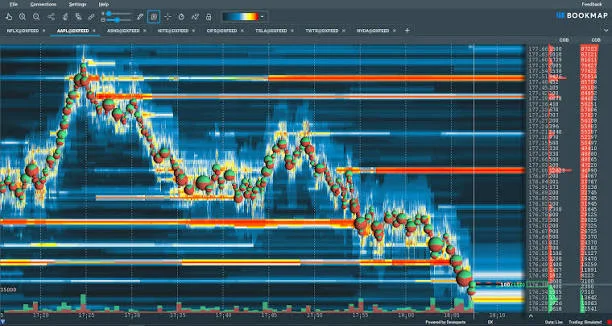
The core of Bookmap’s functionality is its heatmap display, which visualizes the order book across price and time dimensions. The heatmap uses color intensity to represent trading volume at each price level, with brighter colors indicating higher activity. This immediate visual feedback allows traders to quickly identify key support and resistance levels, absorption zones, and areas where liquidity is building or disappearing.
Market Depth Map
Bookmap 7.6.0 includes a comprehensive market depth map that displays resting limit orders across multiple price levels in real time . This feature shows traders where large orders are queued, potentially serving as support, resistance, or liquidity targets. Watching for large limit order clusters being pulled or absorbed often provides early signals of significant price movement.
Cumulative Delta Analysis
The platform tracks cumulative delta, which aggregates buy and sell volume over time to reveal whether net buying or selling pressure is building . This running delta line often leads or diverges from price action during accumulation and distribution phases, making it an essential tool for confirming or challenging conclusions drawn from price alone.
Footprint Chart Integration
Bookmap incorporates footprint chart functionality, displaying bid and ask volume at each price level within bars . This granular view reveals who was more aggressive at each price level and whether that aggression actually moved the market. Traders can spot bid/ask imbalances, where ask volume significantly exceeds bid volume at a given level—typically flagged at ratios of 3:1 or greater indicating aggressive buying.
Volume Profile
Volume profile tools overlay histograms showing how much volume traded at each price level over specified periods . This helps traders identify key reference levels where the market spent the most activity and, by extension, where it avoided trading. Volume profile complements the heatmap by providing a historical perspective on value areas and points of control.
Multi-Asset Support
Bookmap 7.6.0 supports trading across multiple asset classes including futures (E-mini S&P 500, Nasdaq futures, crude oil, Treasury futures), equities, cryptocurrencies (Binance, Coinbase, Kraken), and forex. The platform connects to numerous brokers and data providers, offering flexibility for traders with diverse market interests .
What’s New in Bookmap 7.6.0
Performance Optimizations
Version 7.6.0 introduces significant performance improvements, enabling faster data processing and reduced latency. This is particularly important for futures and cryptocurrency traders who require low-latency data for rapid market movements throughout the trading session . The updated architecture handles streaming millions of market data updates while running numerous charts and indicators simultaneously.
Enhanced Plugin Ecosystem
Bookmap 7.6.0 features an expanded plugin ecosystem, with verified third-party tools such as the Zoli P&L Tracker and Trade Log available for download . These plugins extend platform functionality, allowing traders to customize their workspace with profit tracking, trade logging, and other analytical tools. The platform’s open API enables developers to create additional functionality.
Improved Connectivity
The latest version expands connectivity options, supporting additional brokers and data providers including Tradovate for demo trading accounts . This enhanced integration enables traders to practice order flow strategies without risking capital before transitioning to live trading. Bookmap’s API connections now support even more trading platforms worldwide.
Refined Analytical Tools
Bookmap 7.6.0 includes refined analytical tools based on user feedback. The platform’s order flow analysis now provides more precise detection of absorption and exhaustion patterns . These improvements help traders distinguish between scenarios where one side is filling every order without price movement versus moments when heavy one-sided volume fails to sustain momentum.
System Requirements for Bookmap 7.6.0
Bookmap 7.6.0 is compatible with Windows operating systems, providing robust performance for professional trading environments. Given the platform’s intensive data processing requirements, a modern multi-core processor and sufficient RAM are recommended for optimal performance. The platform also requires a stable internet connection to receive continuous market data streams.
Installation Guide for Bookmap 7.6.0
Download and Setup
To download Bookmap 7.6.0, visit the official Bookmap website and navigate to the download section. The platform provides installation files for Windows systems. After downloading, run the installer and follow the on-screen instructions to complete the installation process.
Account Configuration
New users will need to create a Bookmap account and configure their data subscriptions. The platform connects to various market data providers and brokers depending on the asset class being traded. Users should select their preferred data sources and trading connections during initial setup.
Plugin Installation
Bookmap 7.6.0 supports plugins that extend platform functionality. To install plugins, navigate to the plugin management section and select desired tools like the P&L Tracker. Ensure plugins are compatible with version 7.6.0 to avoid compatibility issues .
How to Use Bookmap Software
Understanding the Heatmap Interface
The heatmap serves as Bookmap’s primary interface, displaying order flow across price levels over time. Color intensity represents trading activity, with bright colors indicating high volume at specific price levels. This visualization helps traders identify where significant buying or selling pressure occurs, often marking key support and resistance zones.
Reading Order Flow Signals
Bookmap reveals several critical order flow signals. The cumulative delta line shows whether buyers or sellers are dominating execution . Absorption appears when one side repeatedly hits a price level but price doesn’t move—the other side is filling every order without budging. Exhaustion looks similar but resolves differently: after heavy one-sided volume, the aggressor gives up and price snaps back sharply. Recognizing the difference between absorption and exhaustion is a key skill for Bookmap users .
Combining with Traditional Analysis
Experienced traders use Bookmap alongside more familiar charting methods. Support and resistance analysis, trend identification, moving averages, and volume studies remain valuable references . Order flow adds another layer of information that helps confirm or challenge conclusions drawn from price alone, providing a more complete picture of market structure and participant behavior .
Using the Order Flow Bubble Visualization
The platform includes order flow bubble visualization, where bubbles mark the exact footprint row where the strongest trading activity occurred . These bubbles scale based on the strength of activity, with larger bubbles indicating unusually strong order flow compared to historical averages. Important levels remain on the chart until price interacts with them again, making it possible to track where strong market participants previously entered.
Best Use Cases for Bookmap
Futures Trading
Bookmap is particularly effective for futures traders who place great emphasis on execution quality, market depth, and real-time data . Markets such as the E-mini S&P 500, Nasdaq futures, crude oil, and Treasury futures can move rapidly throughout the trading session, making low-latency data and order flow analysis essential. The platform’s heatmap provides immediate visibility into liquidity, absorption, imbalance, and participant behavior around important price levels.
Cryptocurrency Trading
Crypto markets operate continuously without traditional opening and closing sessions, creating unique analytical challenges . Bookmap helps cryptocurrency traders monitor liquidity across multiple exchanges, identify aggressive buying or selling pressure, and track institutional activity. The platform’s ability to consolidate multiple venues provides additional context for trading decisions.
Equities Trading
Stock traders benefit from Bookmap’s combination of charting with Level II market data . The platform provides visibility into the order book, helping traders understand where institutional orders are positioned and how they interact with price levels. This information is particularly valuable for trading individual stocks responding to company-specific events.
Professional Trading Desks
Professional trading desks and prop trading firms use Bookmap as part of their evaluation and funded account trading workflows . The platform’s order flow tools help traders confirm trade setups with real order activity rather than relying solely on chart patterns. This verification process is essential for traders managing larger positions.
Advantages and Limitations of Bookmap
Advantages
Unmatched Market Transparency: Bookmap reveals hidden order flow and liquidity that standard charts cannot display, providing insight into institutional trading activity.
Real-Time Decision Support: The platform processes streaming tick data to deliver real-time visualizations, enabling traders to make decisions based on current market conditions rather than lagging indicators .
Multi-Asset Capability: With support for futures, equities, cryptocurrencies, and forex, Bookmap serves traders across diverse markets .
Plugin Ecosystem: Verified third-party tools extend platform functionality, allowing traders to customize their workspace with profit tracking and trade logging features .
Professional-Grade Performance: Version 7.6.0 delivers optimized performance suitable for demanding professional trading environments.
Limitations
Learning Curve: The platform’s sophisticated order flow analysis requires time to master effectively. Beginners may find the heatmap and order flow concepts unfamiliar compared to traditional charting.
Data Subscription Costs: Access to real-time market data, particularly for futures and equities, requires subscription fees.
Desktop-Focused: While offering superior analytical capabilities, the desktop platform lacks mobile accessibility. Active traders often combine desktop and mobile solutions for flexibility .
Resource Intensive: Streaming millions of market data updates requires adequate system resources for optimal performance.
Alternatives to Bookmap
NinjaTrader Order Flow+
NinjaTrader’s Order Flow+ suite offers a comprehensive set of tools for futures prop traders, including volume profile, volumetric bar (footprint) charts, VWAP, cumulative delta data, and market depth maps . These tools work together to provide context, confirm execution, and validate momentum. NinjaTrader’s TPO (Time Price Opportunity) charts organize price and time data to show which prices were visited during specific session segments . The platform’s integration with futures trading makes it a strong alternative for traders focused on that market.
FlowFootprint MT5/MT4
FlowFootprint is an order flow and footprint chart toolkit for MT5 and MT4 traders, designed to expose hidden buyer and seller pressure at every price level . The tool visualizes bid-ask volume imbalance, delta clusters, absorption zones, and aggressive market participation in real time. Features include footprint cells with bid x ask volume per price level, delta heatmaps, imbalance stacks, cumulative delta, POC markers, and value area shading . This alternative is well-suited for MetaTrader users seeking footprint chart capabilities.
Orderflow Tool by OmegaTools
This TradingView indicator is a volume-based analytical suite that reconstructs buying and selling pressure from intrabar data . It presents four complementary layers: directional volume bubbles on the chart, statistically defined extreme order-flow zones, a multi-factor cumulative delta oscillator, and an automated divergence engine. The tool normalizes every derived metric against its own recent standard deviation, providing consistent behavior across different instruments and volatility regimes .
OutsiderEdge Orderflow Bubble Engine
This TradingView indicator requires a Premium or Ultimate subscription because it uses the Footprint API. It detects the exact price level where the strongest buying or selling pressure occurred inside each candle, visualizing these levels with dynamic bubbles and extendable liquidity lines . The indicator can mark the candle’s Point of Control using gold bubbles and levels, and it filters insignificant activity using absolute or moving-average based thresholds .
StockSharp
StockSharp is a free open-source platform for algorithmic trading available at all markets worldwide . It provides connections to numerous exchanges and brokers, visual strategy designer tools, market data storage, and trading terminal features. The platform offers a complete API in C# for building custom trading strategies, from long-term positional strategies to high-frequency strategies with direct market access .
Frequently Asked Questions
What is Bookmap software used for?
Bookmap is an order flow trading platform that visualizes market microstructure through heatmaps and liquidity analysis. It helps traders see where buying and selling pressure is concentrated, identify absorption and exhaustion zones, and understand institutional trading activity. The platform reveals hidden order flow that traditional candlestick charts obscure, providing transparency into actual market mechanics .
Is Bookmap suitable for beginners?
Bookmap has a learning curve due to its sophisticated order flow analysis tools. Beginners should familiarize themselves with order flow concepts and practice with demo accounts before trading with real capital. The platform’s Tradovate demo integration allows users to practice without risking funds . The software is best approached as an advanced tool for traders who have already mastered traditional technical analysis.
What are the minimum system requirements for Bookmap 7.6.0?
Bookmap 7.6.0 runs on Windows operating systems. For optimal performance, a modern multi-core processor and sufficient RAM are recommended. The platform requires a stable internet connection to receive continuous market data. Resource requirements increase with the number of simultaneously displayed charts and indicators.
How does Bookmap compare to traditional charting platforms?
Traditional charting platforms display the outcome of trading activity through candlestick patterns and technical indicators. Bookmap approaches market analysis differently by attempting to visualize why price moved . Instead of only showing where price has traveled, Bookmap reveals where liquidity is building, how large participants interact with the order book, and whether aggressive buyers or sellers are dominating execution . Many traders use both methods, with traditional analysis providing context and Bookmap offering confirmation.
Can I use Bookmap for cryptocurrency trading?
Yes, Bookmap supports cryptocurrency trading with connections to major exchanges including Binance, Coinbase, Kraken, and others. The platform helps cryptocurrency traders monitor aggregated liquidity across multiple venues, identify aggressive buying or selling pressure, and track institutional activity. Crypto markets operate continuously, and Bookmap’s real-time analysis helps traders navigate the unique challenges of round-the-clock trading .
What is the cumulative delta indicator in Bookmap?
Cumulative delta aggregates buy and sell volume over time into a running delta that reveals whether net buying or selling pressure is building . Traders watch the running delta alongside price direction to identify divergences, which are often more actionable than confirmation. Cumulative delta helps reveal who is driving current price movement rather than predicting future direction .
What are footprint charts in order flow trading?
Footprint charts display bid and ask volume at each price level within a bar, allowing traders to identify buying and selling pressure as it develops . They reveal two core signals: who was more aggressive at each price level and whether that aggression actually moved the market. Reading bid/ask imbalances and identifying absorption versus exhaustion in real time are among the highest-value applications of footprint data .
Does Bookmap offer mobile access?
Bookmap is primarily a desktop platform designed for intensive analysis and workspace flexibility. Desktop systems allow traders to display multiple synchronized charts, news feeds, watchlists, execution windows, market scanners, and portfolio information simultaneously . Mobile applications prioritize accessibility and monitoring existing positions rather than the comprehensive analysis that Bookmap provides. Many traders combine desktop Bookmap with mobile monitoring capabilities .
Final Thoughts
Bookmap 7.6.0 stands as a sophisticated order flow trading platform that provides institutional-grade market transparency to serious traders. The software’s heatmap visualization, cumulative delta analysis, and footprint chart capabilities deliver actionable insights into market microstructure that traditional charting cannot match. For traders who want to understand why markets move rather than simply where they move, Bookmap offers an invaluable perspective.
The latest version’s performance improvements, expanded connectivity, and enhanced plugin ecosystem make it a robust choice for professional traders across multiple asset classes. While the platform requires dedicated time to master, the insights gained from understanding order flow and liquidity can significantly improve trading decisions. As trading software evolves, platforms like Bookmap that provide transparency into market mechanics will likely become increasingly essential for traders seeking an edge in competitive markets.
Our Paid Service