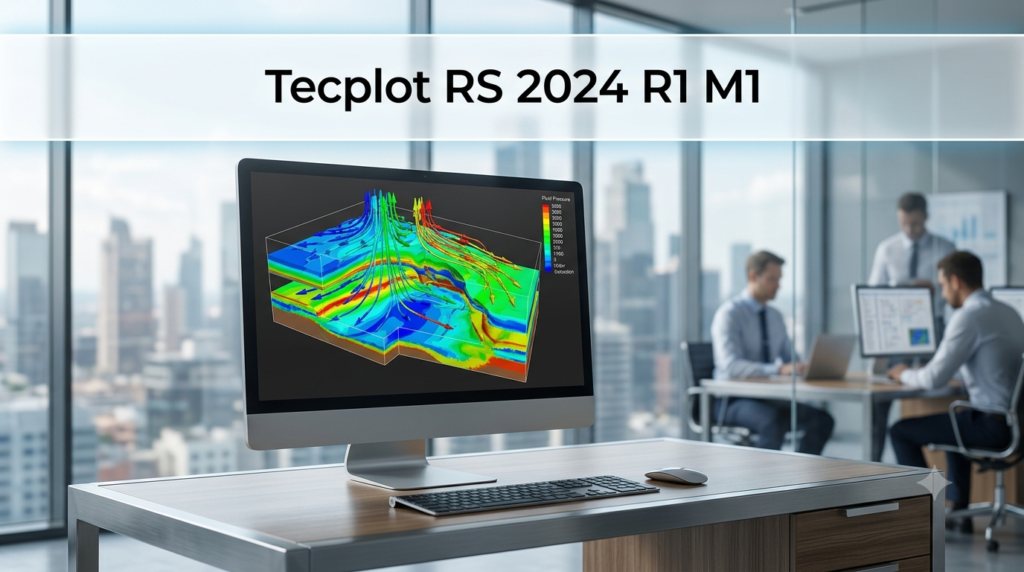

Overview of Tecplot RS 2024 R1 M1
Table of Contents
Tecplot RS is a specialized visualization and analysis software application designed specifically for reservoir simulation post-processing in the oil and gas industry . Developed by Tecplot, Inc., this powerful reservoir simulation tool is used primarily by reservoir engineers, geoscientists, and technical professionals to visualize, analyze, and communicate complex reservoir simulation model results .
The software distinguishes itself as an all-in-one XY, 2D, and 3D solution that transforms raw simulation data into actionable insights . Tecplot RS enables teams to validate reservoir model predictions, collaborate across departments, and present findings to management with professional-quality visualizations .
Key Features
2D and 3D Visualization Capabilities
Tecplot RS offers comprehensive visualization options that allow engineers to examine reservoir data from multiple perspectives:
-
Map Views: Create detailed 2D maps displaying essential reservoir properties such as porosity, permeability, and oil saturation
-
Cross-Sections: Slice through 3D models to analyze internal changes and geological structures
-
3D Volumetric Rendering: Visualize entire reservoir models in three dimensions to understand complex geological formations and fluid movement patterns
Interactive XY Plotting
The 2024 R1 release introduces enhanced interactive XY plotting capabilities :
-
Manual Mode Selection: Users can now enter manual mode in multi-frame XY plots to interactively choose which entity or variable to display in each frame
-
Frame Selection: A new selection menu in the animation control area activates when entering multi-frame mode, allowing users to right-click frames and select desired entities or variables
Independent Arbitrary Slice Frames
This feature addresses a common visualization challenge where arbitrary slices in 3D mode become difficult to interpret due to component placement :
-
Flattened Components: The new independent slice frame feature separates and “flattens” each arbitrary slice component into its own frame
-
Component Control: Users can display or hide individual components through the sidebar
RFT Geo Layers Import
Manual entry of geo layer definitions for RFT plots has been significantly streamlined :
-
CSV/TXT File Import: Geo layer definitions (tops, bottoms, colors) can now be assembled and imported directly from CSV or TXT files
-
Simplified Workflow: This feature eliminates the cumbersome manual data entry process
Data Export and Integration
Tecplot RS supports efficient data handling through multiple export options :
-
Flexible Export Formats: Column sequential and row sequential write data options allow users to export data across columns or down rows
-
Wide Format Compatibility: The software supports major reservoir simulator formats including ECLIPSE, CHEARS, VIP/Nexus, CMG, VDB, FrontSim, 3DSL, UTCHEM, SENSOR®, GRDECL, and INTERSECT RESQML
Guided Tutorial Dashboard
A built-in learning system helps new and experienced users maximize the software’s potential :
-
Interactive Tutorials: Embedded step-by-step teaching tools walk users through useful workflows
-
Centralized Library: The tutorial dashboard provides previews of each available guide and serves as a continuously expanding resource
Time-Based Animation
One of the most powerful features allows engineers to animate fluid flow through reservoirs over time :
-
Fluid Movement Visualization: Engineers can visualize oil, gas, and water flow across 10, 20, or 30-year simulation periods
-
Decision Support: This capability is crucial for understanding flood fronts, identifying bypassed oil, and communicating reservoir behavior to management
Well Performance Analysis
Tecplot RS provides comprehensive tools for evaluating well performance :
-
Production Tracking: Plot and compare well data including production rates, pressures, and gas-oil ratios
-
Historical Comparison: Track individual well or group performance over the entire field life
History Matching Capabilities
Engineers can calibrate simulation models to match historical production data :
-
Data Overlay: Powerful tools allow users to overlay historical data with simulated results
-
Mismatch Identification: Easy visualization of discrepancies guides model adjustments
Comparison of Multiple Scenarios
The software enables comprehensive scenario analysis :
-
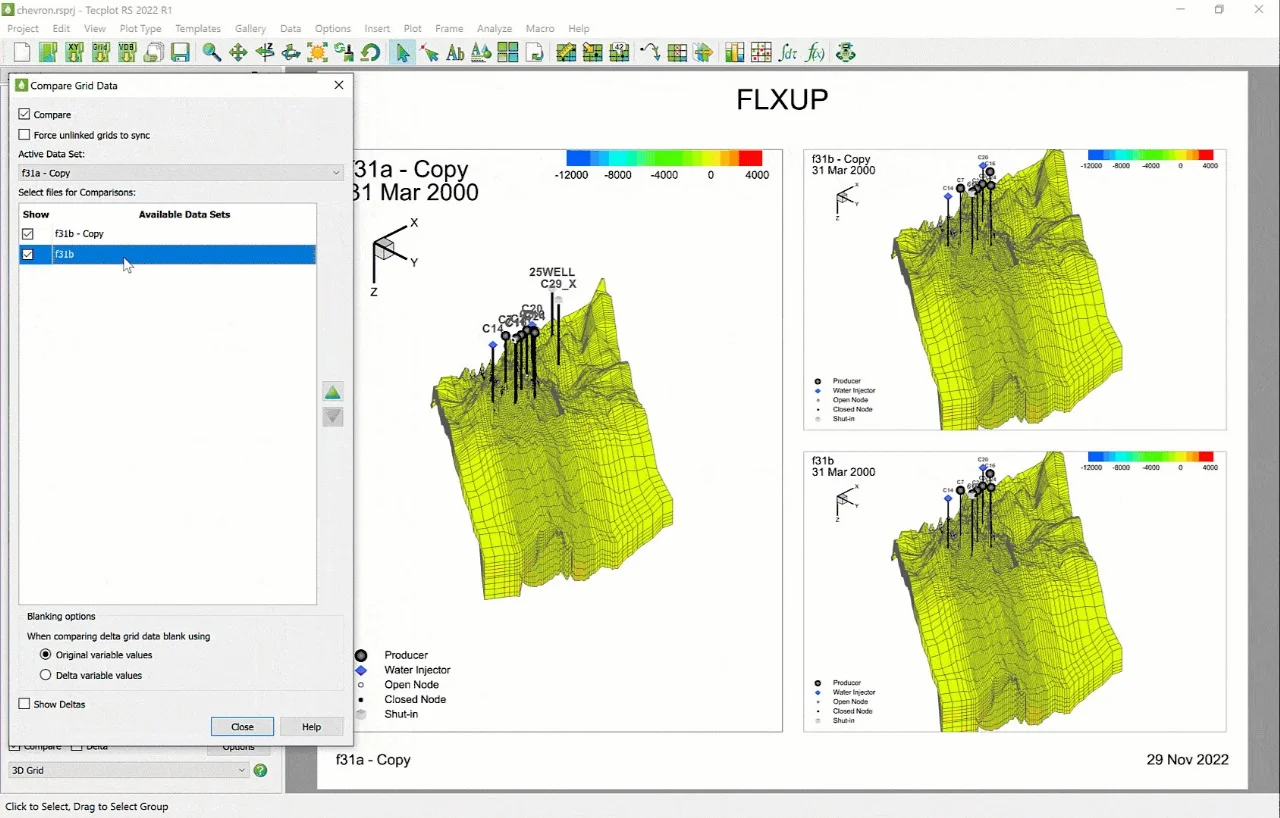
Side-by-Side Comparison: Load multiple simulation runs simultaneously
-
Optimal Planning: Compare different well placements, injection strategies, or economic forecasts
Data Integration
Tecplot RS integrates diverse data types for complete geological context :
-
Seismic Integration: Combines seismic interpretations with simulation models
-
Well Log Integration: Incorporates well log data for enhanced geological understanding
What’s New in Tecplot RS 2024 R1
The 2024 R1 release brings several significant enhancements to the reservoir simulation visualization tool :
Enhanced Interactive XY Plotting
Users can now manually select entities and variables for each frame in multi-frame mode. After entering multi-frame mode, a selection menu activates with a manual option. Users can interactively select frames and choose desired entities or variables through the sidebar or by right-clicking frames .
Independent Arbitrary Slice Frames
This feature improves visualization of complex arbitrary slices by separating and flattening each component into its own frame. Users activate this by checking the “independent slice frames” checkbox. The original arbitrary slice remains visible while non-active frames display individual components .
RFT Geo Layers – CSV/TXT File Import
Definitions for geo layers (tops, bottoms, colors) in RFT plots can now be imported directly from CSV or TXT files, simplifying what was previously a cumbersome manual entry process .
Column and Row Sequential Write Data Options
The Write XY dialog now includes column sequential and row sequential export options under the Format section .
Guided Tutorial Dashboard
A complete guided tutorial dashboard is accessible via the toolbar or Help menu, serving as a library of interactive teaching tools .
Additional Enhancements
-
Reload functionality extended to 2D/3D data
-
Time Delta integration with KSUM and KAVG with revamped UI
-
Dual porosity CORSNUM support
-
Standard deviation range options for 2D/3D variable ranges
-
KAVG contour range display fixes
-
Macro support for histogram and cross plot controls
System Requirements
Operating Systems
-
Windows: Win7, WIN10, and later versions
-
Mac: macOS compatible
-
Linux: Linux platforms supported
Supported File Formats
Tecplot RS imports and exports a comprehensive range of formats :
Input Formats:
-
CGNS
-
DXF
-
EXCEL
-
GRIDGEN
-
PLOT3D
-
PHOENICS, FLUENT, STAR-CD files
-
ECLIPSE, CHEARS, VIP/Nexus, CMG, VDB, FrontSim, 3DSL, UTCHEM, SENSOR®, GRDECL, INTERSECT RESQML
Output Formats:
-
BMP
-
AVI
-
FLASH
-
JPEG
-
WINDOWS
Installation Guide
Standard Installation Process
-
Download the Installation Package: Obtain the official Tecplot RS 2024 R1 M1 installer from the authorized Tecplot, Inc. website or an approved distributor .
-
Verify System Compatibility: Ensure your system meets the minimum requirements for Windows, Mac, or Linux platforms .
-
Run the Installer: Execute the installation file with appropriate administrative privileges.
-
Follow Installation Wizard: Complete the installation by following the on-screen prompts.
-
Product Activation: Activate your license using the provided license key or network license configuration.
Silent Installation
Tecplot RS 2024 R1 supports silent installations with user-specified installation directories .
How to Use the Software
Getting Started
-
Launch Tecplot RS: Open the application from the Start menu or desktop shortcut.
-
Welcome Screen Navigation: Use the welcome screen to access tutorials, recent projects, or create new sessions .
-
Load Data: Load simulation files using the menu bar or loading dialogs .
Creating Basic Plots
Tecplot RS provides several plot types for data analysis :
XY Plots
-
Load XY data files or entire folders
-
Manage and swap data files as needed
-
Align start times for consistent comparison
-
Customize axes, variables, and entities
Grid Plots
-
Load grid data from multiple simulator formats
-
Create 2D cross-sections and 3D volumetric renderings
-
Apply filters and selection sets
-
Use KSUM/KAVG for statistical analysis
Specialty Plots
-
RFT Plots: Visualize repeat formation tester data with customizable geo layers
-
Completion Profiles: Analyze well completion data
-
Flow Tables: Display flow table information
Data Management
The software provides efficient data management through:
-
Property Modifier: Create ASCII files for simulator input to modify grid properties
-
Data Extraction: Export cell or well data to CSV or other formats
-
Sector Extraction: Extract continuous IJK ranges of cells
Advanced Analysis Tools
-
Time-Based Animation: Visualize fluid flow evolution over simulation periods
-
History Match: Calibrate simulation models to historical production data
-
Scenario Comparison: Evaluate multiple simulation runs simultaneously
Best Use Cases
Reservoir Simulation Post-Processing
Tecplot RS excels at transforming raw simulation outputs into actionable insights:
-
Visual Validation: Quickly identify anomalies in simulation results
-
Model Calibration: Fine-tune simulation models through history matching
-
Scenario Analysis: Compare different development strategies
Technical Team Collaboration
The software facilitates effective collaboration among technical teams:
-
Data Integration: Combine seismic interpretations and well logs with simulation data
-
Standardized Views: Save and share custom views through the plot gallery
-
Export Options: Generate professional visualizations for reports and presentations
Management Communication
Professional-quality visualizations help communicate complex results:
-
Realistic Images: Create publication-ready graphics
-
Time-Based Animations: Demonstrate fluid behavior over time
-
Clear Comparisons: Show scenario differences side-by-side
Advantages and Limitations
Advantages
| Feature | Benefit |
|---|---|
| All-in-One Platform | Combines XY, 2D, and 3D capabilities in a single tool |
| Short Learning Curve | Intuitive interface with full technical support and free training |
| Comprehensive Format Support | Compatible with major reservoir simulators |
| Efficient Data Loading | Quick access to views needed for data comprehension |
| Powerful Analysis Tools | Built-in statistical analysis for detailed model characterization |
| Automation Capabilities | Macro recording for repetitive tasks |
| Interactive Tutorials | Embedded teaching tools for skill development |
Limitations
-
Specialized Focus: Primarily designed for reservoir simulation, not general-purpose visualization
-
Licensing Cost: Professional-grade software requires commercial licensing
Alternatives to Tecplot RS
Comparison with Similar Tools
| Feature | Tecplot RS | Similar Tools |
|---|---|---|
| Primary Focus | Reservoir simulation visualization | General CFD, general plotting |
| Reservoir Simulator Support | ECLIPSE, CHEARS, VIP, CMG, VDB, more | Limited to specific formats |
| Specialized Workflows | History match, RFT plots, flow tables | General plotting capabilities |
| Learning Curve | Designed specifically for reservoir engineers | Varies by tool type |
| Visual Quality | Industry-leading visualization quality | Varies |
Tecplot Product Family
Tecplot, Inc. offers three main products :
-
Tecplot 360: CFD and numerical simulation visualization
-
Tecplot Focus: Engineering plotting and mathematical analysis
-
Tecplot RS: Reservoir simulation visualization and analysis
Frequently Asked Questions
What is Tecplot RS used for?
Tecplot RS is a specialized visualization and analysis tool designed for reservoir engineers. It is used to visualize, analyze, and communicate results from reservoir simulation models. The software supports XY plots, 2D cross-sections, and 3D volumetric rendering to help engineers understand reservoir behavior and optimize field development .
What data formats does Tecplot RS support?
Tecplot RS supports a wide range of reservoir simulator formats including ECLIPSE, CHEARS, VIP/Nexus, CMG, VDB, FrontSim, 3DSL, UTCHEM, SENSOR®, GRDECL, and INTERSECT RESQML. It also imports CGNS, DXF, EXCEL, GRIDGEN, and PLOT3D formats .
What operating systems does Tecplot RS support?
Tecplot RS supports Windows (Win7, WIN10, and later), Mac operating systems, and Linux platforms. This cross-platform compatibility allows users to work in their preferred environment .
What is the guided tutorial dashboard?
The guided tutorial dashboard is a library of interactive teaching tools introduced in Tecplot RS 2024 R1. These embedded tutorials walk users through useful workflows step by step. The dashboard can be accessed through the toolbar icon or Help menu, and additional tutorials will be added in future releases .
How does history matching work in Tecplot RS?
History matching is a critical process where engineers calibrate simulation models to match historical production data. Tecplot RS provides powerful tools to overlay historical data with simulated results, making it easy to identify mismatches. The History Match Workflow Module includes interactive tutorials to guide users through this process .
What are the data extraction options available?
Tecplot RS provides multiple data extraction options. Users can extract data by cells (CSV or sector data), by wells, or use the Property Modifier to create ASCII files for simulator input. Extractions can include visible or all cells, specific variables, and selected time steps .
How can I automate repetitive tasks in Tecplot RS?
Tecplot RS supports macro recording for automating repetitive tasks. Users can record and save macros to streamline workflows and save valuable time. The 2024 R1 release also includes enhanced macro support for enabling and disabling histograms and cross plots .
Final Thoughts
Tecplot RS 2024 R1 M1 represents a significant advancement in reservoir simulation visualization and analysis tools. The software’s specialized focus on the oil and gas industry, combined with its all-in-one XY, 2D, and 3D capabilities, makes it an essential solution for reservoir engineers seeking to extract maximum value from simulation data.
The 2024 R1 release introduces meaningful enhancements including interactive XY plotting, independent arbitrary slice frames, CSV/TXT import for RFT geo layers, and the guided tutorial dashboard. These improvements demonstrate Tecplot, Inc.’s commitment to addressing real user needs and streamlining workflows.
For reservoir engineers, geoscientists, and technical professionals in the energy sector, Tecplot RS offers the visualization power, analysis capabilities, and data integration needed to make informed decisions about reservoir development. Its short learning curve, comprehensive support, and free online training ensure users can quickly leverage the software’s full potential .
Whether validating simulation models, comparing development scenarios, or communicating results to stakeholders, Tecplot RS provides the professional-quality visualizations and analytical tools required for effective reservoir management and optimization.