


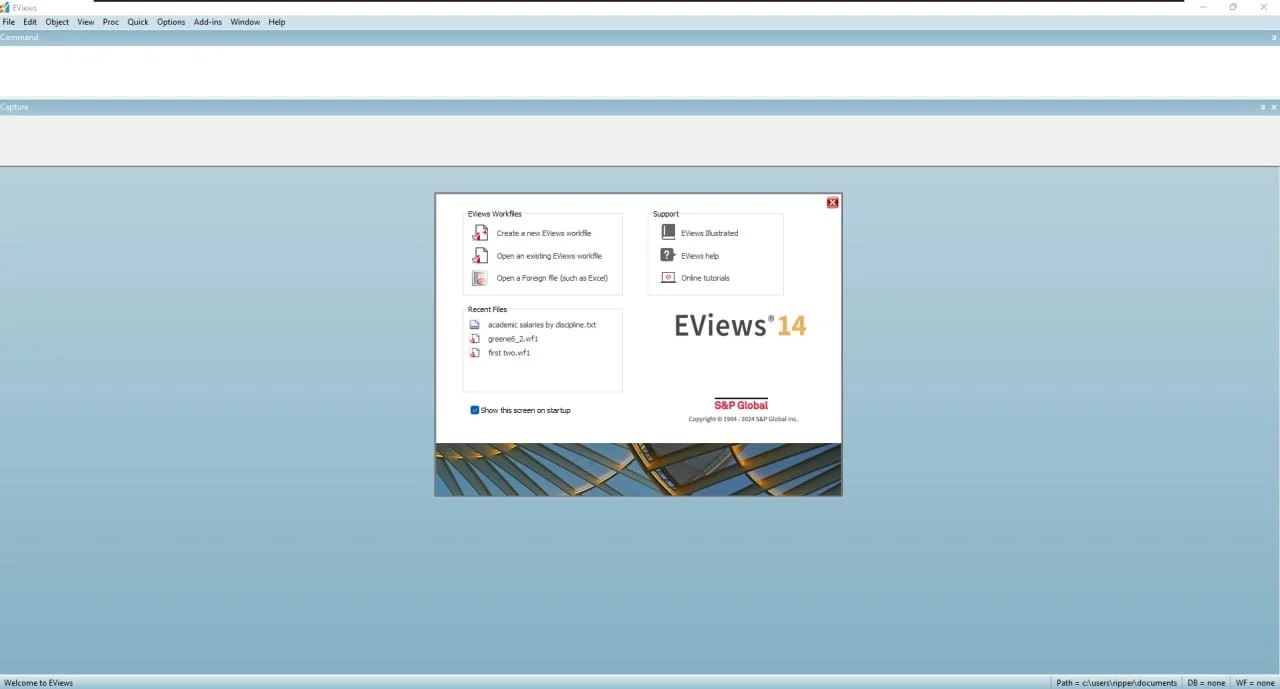
Overview of the Software
Table of Contents
EViews—short for “Econometrics Views”—is a statistical software package designed for time series analysis, forecasting, and econometric modeling. The software’s hallmark is its ability to combine powerful analytical capabilities with an accessible interface, making it the preferred choice for macroeconomists, financial analysts, and academic researchers worldwide .
The Enterprise Edition extends standard capabilities with advanced data connectivity features . It allows direct connections to third-party data providers including Bloomberg, CEIC, Datastream, Haver Analytics, and Trading Economics. Users can also access ODBC-compliant databases such as Oracle, Microsoft SQL Server, and IBM DB2, plus cloud storage platforms like Dropbox, OneDrive, Google Drive, and Box . This means you can work with live data feeds rather than static imports, ensuring your analysis always reflects current information.
The software’s object-oriented interface is central to its design. Every element—time series, equations, graphs, models—is an object with its own window, menu system, and data views. This approach creates an intuitive workflow where you can easily switch between spreadsheet views, statistical tests, and graphical displays with simple menu selections .
Key Features
Data Management and Processing
EViews 14 Enterprise Edition provides comprehensive data handling capabilities for both time series and cross-sectional data:
Supported Data Structures:
-
Regular and irregular date series with annual, semi-annual, quarterly, monthly, and daily frequencies
-
High-frequency intraday data supporting hourly, minute, and second intervals
-
Panel data with date and undated observations
-
Multi-page workfiles for organizing complex projects
Data Import and Connectivity:
-
Import data from Microsoft Excel, Access, SPSS, SAS, Stata, R, Gauss, and Tableau
-
Direct access to FRED (Federal Reserve Economic Data), DBNomics, World Bank, WHO, OECD, UN, and IMF databases
-
Enterprise Edition: Direct connections to Bloomberg, CEIC, Datastream, Haver Analytics, FAME, EcoWin, EIA, and Moody’s Economy.com
-
ODBC connectivity for relational databases
-
Drag-and-drop file import for over 20 formats
-
Automated frequency conversion when copying data between different frequencies
Data Transformation Tools:
-
Powerful expression language with extensive statistical, mathematical, and string functions
-
Automatic formula series that recalculate when underlying data changes
-
Resampling and random number generation for simulation studies
-
Workfile merging, appending, subsetting, and reshaping capabilities
Statistical and Econometric Analysis
Basic Statistics:
-
Summary statistics with grouping
-
Hypothesis testing: t-tests, ANOVA, Wilcoxon, Mann-Whitney, Kruskal-Wallis, and more
-
Cross-tabulation with association measures (Phi, Cramer’s V) and independence tests
-
Correlation analysis: Pearson, Spearman, and Kendall methods
-
Principal components analysis with scree plots and biplots
-
Factor analysis with over 30 orthogonal and oblique rotation methods
-
Distribution fitting with EDF tests for 18 distributions
Time Series Analysis Tools:
-
Autocorrelation and partial autocorrelation functions with Q-statistics
-
Unit root tests: ADF, Phillips-Perron, KPSS, DFGLS, Ng-Perron, and tests with structural breaks
-
Cointegration tests: Johansen, Engle-Granger, Phillips-Ouliaris, and panel cointegration
-
Granger causality tests including panel variants
-
Seasonal adjustment using Census X-13, JDemetra+, STL Decomposition, Tramo/Seats
-
Hodrick-Prescott filtering and band-pass filters (Baxter-King, Christiano-Fitzgerald)
-
Wavelet analysis for transformation and variance decomposition
-
Outlier detection through ARIMA and wavelet methods
Panel Data:
-
Group and period-specific statistics and tests
-
Panel unit root tests: Levin-Lin-Chu, Breitung, Im-Pesaran-Shin, Fisher, Hadri, CIPS
-
Panel cointegration: Pedroni, Kao, Maddala-Wu
-
Dumitrescu-Hurlin panel causality test
-
Cross-sectional dependence testing
Estimation Methods
Single Equation Models:
-
Linear and nonlinear OLS (multiple regression)
-
Robust regression and weighted least squares
-
Quantile regression with LAD estimation
-
Threshold regression including TAR, SETAR, and STAR
-
ARDL estimation with bounds testing for cointegration
-
Elastic Net, Ridge, and LASSO regression
-
Stepwise regression with seven selection procedures
-
Automatic ARIMA specification
ARMA and ARMAX:
-
Linear models with ARMA, seasonal AR, and seasonal MA errors
-
Nonlinear models with AR and SAR specifications
-
Box-Jenkins estimation with backcasting
-
Fractionally integrated ARFIMA models
Instrumental Variables and GMM:
-
Linear and nonlinear 2SLS/IV estimation
-
Generalized Method of Moments with extensive weighting matrix options
-
LIML and K-class estimation
-
Diagnostics including orthogonality and weak instrument tests
ARCH/GARCH Models:
-
GARCH(p,q), EGARCH, TARCH, Component GARCH, Power ARCH
-
MIDAS GARCH estimation (new in version 14)
-
Normal, Student’s t, and Generalized Error distributions
-
Bollerslev-Wooldridge robust standard errors
Limited Dependent Variable Models:
-
Binary, ordered, censored, and truncated models
-
Count models using Poisson, Negative Binomial, and QML
-
Heckman selection models
System Estimation:
-
OLS, 2SLS, SUR, 3SLS, GMM, and FIML
-
Vector Autoregression (VAR) and Bayesian VAR
-
Mixed-frequency VAR
-
Vector Error Correction Models
What’s New in EViews 14 Enterprise Edition 2026
EViews 14 introduces significant enhancements for econometric modeling and forecasting:
New Estimation Techniques
Facebook Prophet Integration:
EViews 14 provides a graphical user interface for Prophet, the open-source forecasting tool developed by Facebook. You can now access Prophet’s powerful forecasting capabilities through EViews’ intuitive interface without writing Python or R code .
Quantile ARDL (QARDL) Estimation:
This extends traditional ARDL models to capture dynamics across conditional quantiles. Unlike standard models that show average responses, QARDL lets you model how predictor changes affect different percentiles of the dependent variable distribution .
MIDAS GARCH:
Mixed Data Sampling GARCH incorporates information from low-frequency series into high-frequency variance specifications. This allows you to decompose variance into short-run and long-run components—particularly useful when integrating quarterly macroeconomic data with monthly financial models .
Elastic Net Enhancements:
Updated algorithms for more efficient cross-validation, including individual coefficient weights, coefficient bounds, and improved tools for examining coefficient paths and fit statistics .
Advanced Modeling Tools
Local Projection Impulse Response Functions:
New LPIRF analysis provides alternative methodology for computing impulse responses, complementing traditional VAR-based approaches .
Bootstrap Structural VAR Confidence Intervals:
Enhanced inference for structural VAR and structural variance decomposition with bootstrap confidence bands .
Improved Bayesian Time-Varying Coefficient VAR:
Enhanced impulse response capabilities for Bayesian TVP-VAR models .
Testing and Diagnostics
-
Series-based outlier detection
-
Equation residual outlier detection
-
Boosted Hodrick-Prescott filter
-
Trend tests
-
Breakpoint and change-point tests
-
Financial bubble testing
Data Enhancements
-
JDemetra+ seasonal adjustment integration
-
StatCan (Statistics Canada) data connection
-
Updated interfaces for Eurostat, ECB, OECD, UN, and other international data providers
Enterprise-Specific Updates
-
Enhanced third-party data provider connectivity
-
Jupyter kernel support for integrating EViews analysis with Jupyter notebooks
System Requirements
Before installing EViews 14 Enterprise Edition, verify your system meets these minimum specifications :
| Component | Requirement |
|---|---|
| Processor | Pentium or better |
| Operating System | Windows 11 (64-bit), Windows 10 (64-bit), Windows 8.1 (64-bit), Windows 8 (64-bit), Windows Server 2012 (64-bit), Windows Server 2008 (64-bit) |
| Memory (RAM) | 512 MB minimum |
| Hard Disk Space | 400 MB available for executable, support files, documentation, and examples |
| Additional Requirements | .Net 4.0 for external database connections and EViews-Excel Add-in installation |
| Virtual/Remote Environments | Contact support for VMWare, Citrix, or Remote Desktop deployment |
*Server OS installation requires an EViews volume license agreement. EViews 14 is available only as a 64-bit application; there is no 32-bit version .
Installation Guide
Step-by-Step Installation Process
Step 1: Download the Installer
Access the official EViews download portal from your authorized distributor. The 64-bit patch file is approximately 194 MB. Verify the MD5 checksum: 81c0ec43663649f316021c56fc22613e for the EViews 14 64-bit patch .
Step 2: Prepare Your System
-
Close all running applications, especially Microsoft Office programs
-
Ensure Windows is fully updated
-
Verify you have administrator privileges on your machine
-
Temporarily disable antivirus software to prevent installation conflicts
Step 3: Run the Installer
-
Execute the downloaded file
-
Follow the on-screen prompts
-
Accept the license agreement
-
Choose installation location (default recommended)
-
Select components to install
Step 4: Configure Enterprise Features
-
Set up database connections through the ODBC manager if required
-
Configure third-party data provider credentials (Bloomberg, CEIC, etc.)
-
Install EViews-Excel Add-in for seamless Excel integration
Step 5: Update to Latest Version
-
Launch EViews
-
Use the built-in auto-update feature to download the latest patches
-
Alternatively, download and run the cumulative patch file
-
Verify your build date through Help > About EViews
Step 6: Licensing Activation
-
Enter your license key
-
For Enterprise Edition, ensure you have a valid license agreement
-
Contact your distributor for volume licensing or server deployment assistance
How to Use EViews 14 Enterprise Edition
Getting Started
Creating a Workfile:
Launch EViews and create a new workfile by specifying data structure—choose from regular time series frequencies, dated panels, or undated cross-sections. Define your date range and frequency (annual, quarterly, monthly, daily, or intraday intervals) .
Importing Data:
Use drag-and-drop to import files directly into EViews. Supported formats include Excel spreadsheets, CSV files, SPSS, SAS, Stata, R data, and many more. Enterprise Edition users can also connect directly to live data feeds through ODBC or third-party providers .
Data Manipulation:
Transform data using EViews’ expression language. Create formula series that update automatically when source data changes. Use frequency conversion tools when working with mixed-frequency data—simply copy or link between pages of different frequencies, and EViews handles the conversion automatically .
Performing Analysis
Basic Analysis:
Select a series and choose from View or Proc menus to access descriptive statistics, graphs, hypothesis tests, or correlation analysis. The object-oriented interface means different views are just menu selections away.
Time Series Analysis:
Test for unit roots, check autocorrelation, perform cointegration tests, or estimate VAR models through intuitive dialog boxes that guide parameter selection.
Model Estimation:
Choose your estimation method from dropdown menus—OLS, GMM, ARDL, GARCH, or any of the advanced methods introduced in version 14. The software provides comprehensive output with diagnostic statistics and allows you to freeze results for inclusion in reports .
Advanced Enterprise Features
Direct Data Connections:
Connect to Bloomberg, CEIC, Datastream, Haver Analytics, and other providers. Search, query, and retrieve data directly into your workfile, eliminating manual import steps .
Jupyter Integration:
Use EViews as a kernel within Jupyter notebooks for documented, reproducible workflows. This is particularly valuable for collaborative research environments where you need to combine EViews analysis with other tools .
EDX and EDO Libraries:
Develop custom connections to proprietary data sources using the EViews Database Extension Interface, or use the EViews Database Object library to work with EViews file formats in other applications .
Best Use Cases
Academic Research and Teaching
EViews remains a staple in university economics departments for teaching econometrics. Its point-and-click interface allows students to focus on understanding econometric concepts rather than wrestling with code syntax. The software is widely used for:
-
Undergraduate and graduate econometrics courses
-
Master’s and doctoral thesis research
-
Publishing papers with reproducible analysis
-
Teaching time series forecasting methods
Macroeconomic Forecasting
Macroeconomists choose EViews for its best-in-class time series capabilities. The software excels at:
-
GDP and inflation forecasting
-
Leading indicator analysis
-
Policy impact simulation
-
Business cycle analysis
-
Government and central bank economic modeling
Financial Market Analysis
Financial analysts rely on EViews for quantitative research:
-
Asset price and volatility forecasting
-
Risk modeling with GARCH family models
-
Value-at-Risk calculations
-
Algorithmic trading strategy development
-
Portfolio optimization research
Corporate Planning and Budgeting
Corporate analysts use EViews to support strategic planning:
-
Sales and revenue forecasting
-
Budget modeling and scenario planning
-
Market demand analysis
-
Performance measurement and benchmarking
Advantages and Limitations
Advantages
Intuitive User Interface:
EViews combines sophisticated analytical power with a point-and-click interface that doesn’t require programming expertise. Economists can focus on their research questions rather than debugging code .
Comprehensive Time Series Analysis:
The software offers one of the most complete sets of time series tools available, from basic autocorrelation to advanced unit root tests and cointegration analysis .
Live Data Connections:
Enterprise Edition’s direct connections to Bloomberg, CEIC, Datastream, and other providers significantly streamline data workflows.
Educational Value:
The interface makes econometric concepts accessible, making EViews the preferred choice for teaching and learning econometrics .
Quick Forecasting:
The software is optimized for rapid model specification and forecasting, ideal for time-sensitive research and business applications.
Cross-Format Compatibility:
Import data from almost any statistical package and export high-quality output to Word, Excel, and PowerPoint .
Limitations
Cost:
EViews is proprietary, commercial software that can be expensive compared to free alternatives. Enterprise Edition carries a premium for its additional data connectivity features.
Limited Programmability:
While EViews includes a powerful command language, users who prefer coding environments may find R or Python more flexible. Some analysts note EViews can make replication of studies more difficult compared to code-based approaches .
Platform Restrictions:
EViews is a Windows-only application. Mac and Linux users need virtualization solutions or alternative software.
Private Sector Demand:
R and Python dominate in private-sector data analysis and data science roles. EViews skills may not transfer as readily to corporate positions that require coding expertise .
Update Lag:
While new features are added with each release, open-source tools may implement cutting-edge methods more quickly through community contributions.
Alternatives to EViews
Stata
Stata is widely used in microeconometrics and academic research with strong capabilities for panel data, difference-in-differences, and instrumental variables analysis. It offers a more command-line-driven approach that some researchers prefer .
R
R is a powerful open-source programming language for statistical computing with thousands of packages for econometric analysis. It provides unlimited flexibility but requires programming skills and has a steeper learning curve than EViews .
Python
Python has become the language of data science and machine learning. Its ecosystem includes extensive libraries for econometrics, data manipulation, and visualization through pandas, statsmodels, and scikit-learn. Python is free and highly transferable across industries.
Gretl
Gretl is a free, open-source alternative to EViews with an intuitive interface, strong time series capabilities, and support for ARDL, GARCH, and cointegration analysis. It’s ideal for teaching and budget-conscious users .
SAS
SAS is a comprehensive enterprise analytics platform with strong data management and statistical capabilities. It is widely used in government, healthcare, and financial services but is expensive and requires specialized skills.
SPSS
SPSS is user-friendly software popular in social science research, particularly for survey data analysis and complex weighted data .
MATLAB
MATLAB is used by modelers requiring computational power for solving DSGE models and running complex simulations .
Frequently Asked Questions
How does EViews 14 Enterprise Edition differ from the Standard Edition?
Enterprise Edition includes all Standard Edition features plus direct connections to third-party data providers like Bloomberg, CEIC, and Datastream, ODBC database connectivity for Oracle and SQL Server, access to FAME and EcoWin databases, and Jupyter kernel integration. It also supports EDX APIs for custom data source development and EDO libraries for working with EViews files in other applications .
What are the system requirements for EViews 14?
EViews 14 runs on 64-bit Windows operating systems including Windows 11, 10, 8.1, and 8. It requires a Pentium or better processor, 512 MB of RAM, 400 MB of available hard disk space, and .Net 4.0 for database connections and Excel Add-in functionality. Server OS installation requires a volume license agreement. EViews 14 has no 32-bit version .
What new features does EViews 14 include?
EViews 14 introduces Facebook Prophet integration, Quantile ARDL (QARDL) estimation, MIDAS GARCH estimation, enhanced Elastic Net algorithms, Local Projection Impulse Response Functions, bootstrap confidence intervals for structural VAR, boosted Hodrick-Prescott filtering, JDemetra+ seasonal adjustment, and series-based outlier detection .
Can EViews 14 connect to Bloomberg or other financial databases?
Yes, EViews Enterprise Edition can connect directly to Bloomberg, CEIC, Datastream, Haver Analytics, FAME, EcoWin, EIA, Trading Economics, Moody’s Economy.com, and other major financial data providers. You can seamlessly search, query, and retrieve data from these sources into your workfile .
How do I get a free trial of EViews 14?
A free 30-day trial version of EViews 14 for Windows 64-bit is available through authorized distributors. The trial allows you to explore all features and test the software with your own data before committing to a purchase .
Is EViews available for Mac or Linux?
EViews is developed exclusively for Windows operating systems. Mac and Linux users can run EViews using virtualization software such as VMware, Parallels, or CrossOver. For virtual or remote environments like VMWare, Citrix, or Remote Desktop, contact EViews support for deployment assistance .
What data formats can EViews import?
EViews imports data from Microsoft Excel (including .XLSX and .XLSM), Access, SPSS native and portable files, SAS transport files, Stata files, R data files, Gauss datasets, Tableau, ODBC databases, and ASCII text or binary files in raw format. Enterprise Edition adds direct connections to live data feeds. Drag-and-drop support allows you to automatically convert and link external data and metadata .
Final Thoughts
EViews 14 Enterprise Edition 2026 is an exceptional tool for econometric analysis and forecasting, setting the standard for user-friendly statistical software in research and academic settings. Its greatest strength lies in making sophisticated time series analysis accessible to economists and analysts who may not be expert programmers .
The latest release brings impressive new features including Facebook Prophet integration, Quantile ARDL estimation, and MIDAS GARCH modeling—enhancements that will appeal to academic researchers, central bank economists, and financial analysts alike. The Enterprise Edition’s connectivity to Bloomberg, CEIC, and other data providers makes it particularly valuable for organizations that rely on real-time economic and financial data .
However, users should consider their long-term career and research needs. Private-sector data science increasingly favors open-source tools like R and Python . EViews is best suited for environments where rapid, intuitive analysis takes priority over programmatic flexibility, and where institutional budgets support commercial software licensing.
For economists, educators, and researchers who prioritize quick forecasting, pedagogical accessibility, and comprehensive time series functionality, EViews remains the clear choice. Its 2026 Enterprise Edition release demonstrates continued commitment to innovation in the specialized field of econometric analysis and forecasting.