


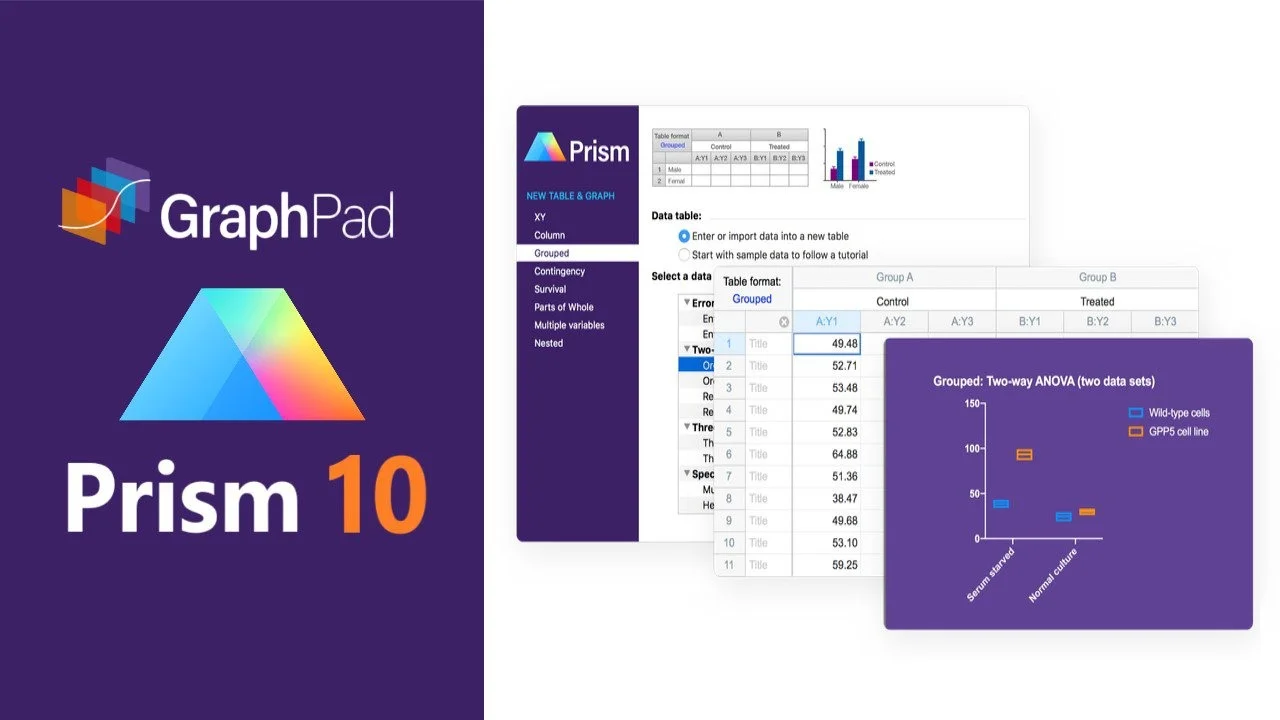
Overview of GraphPad Prism 10.6.0 Enterprise
Table of Contents
GraphPad Prism combines scientific graphing, comprehensive curve fitting, and statistical analysis in one integrated program. Researchers and scientists use Prism to create publication-quality graphs, perform complex statistical tests, and analyze biological data efficiently. The Enterprise edition offers advanced features designed for institutional use, including enhanced clustering capabilities and expanded data handling capacities.
The software supports a wide range of analysis types, including t-tests, ANOVA, nonparametric tests, survival analysis, and regression modeling. Prism 10.6.0, released in August 2025, introduces significant improvements in clustering analysis and data manipulation.
Key Features of Prism 10.6.0 Enterprise
Advanced Data Analysis Capabilities
Prism 10.6.0 Enterprise includes sophisticated analytical tools that set it apart from standard versions:
Automatic Cluster Number Selection: The Enterprise edition introduces a consensus metric feature that automatically determines the optimal number of clusters for K-means clustering analysis. It evaluates 17 different methods and metrics, providing a data-driven recommendation by identifying which cluster count receives the most “votes” across all methods.
Enhanced Data Extraction and Rearrangement: The improved Extract and Rearrange analysis offers precise control over data manipulation. New options include defining subject variables for repeated measures designs, preserving row titles, and reporting only complete rows without blank entries.
Advanced Regression Modeling: Multiple linear regression, logistic regression, and Cox proportional hazards models benefit from redesigned confidence interval options, making statistical analysis more intuitive and accessible.
Scientific Graphing and Visualization
SVG Export Support: Prism 10.6 now supports exporting graphics and layouts as scalable vector graphics (SVG) files, ensuring crisp, resolution-independent images suitable for publication.
Enhanced Magic Dialog Controls: The Magic feature now allows independent control over graph titles, X-axis titles, and Y-axis titles when formatting multiple graphs, providing more precise layout customization.
Improved Heatmap Performance: Rendering for large dataset heatmaps has been significantly optimized, delivering smoother performance when working with big data.
What’s New in GraphPad Prism 10.6.0
GraphPad Prism 10.6.0, released on August 20, 2025, brings several important updates and new features:
K-Means Clustering Consensus Metrics: This Enterprise-only feature automatically determines optimal cluster numbers using 17 analytical methods, eliminating guesswork in cluster analysis.
Improved Title Controls: The Magic dialog now supports independent title modifications, allowing users to selectively update graph, X-axis, and Y-axis titles.
Enhanced Extract and Rearrange: New subject variable support, custom row titles, and smart conflict alerts improve data transformation workflows.
Performance Optimization: Hot graph rendering for large datasets has been improved, and table switching with large imported images is now faster.
System Requirements for GraphPad Prism 10.6.0
Windows System Requirements
Operating System: 64-bit versions of Windows 10 and Windows 11. Prism 10 does not support 32-bit Windows.
Processor: x64-compatible processor. While ARM chipsets are not natively supported, Prism can run on ARM-driven devices using x64 emulation in Windows 11.
Memory (RAM) Requirements:
-
2 GB RAM for up to 2 million data units
-
4 GB RAM for 2-8 million data units
-
8 GB RAM for 8-16 million data units
-
16 GB RAM for over 16 million data units
Display: Minimum 800×600 resolution; 1366×768 recommended for comfortable use.
Hard Disk Space: Approximately 140 MB required.
Network: Internet connection required for initial activation. Prism must connect every 30 days to validate licenses, with automatic connection attempts every 24 hours when the application is open.
Additional Requirement: Microsoft Edge WebView2 rendering component is needed for proper display in the welcome dialog.
Mac System Requirements
Operating System: macOS X 10.15 (Catalina) or higher. Prism 10 versions 10.0.0 through 10.4.1 may run on macOS 10.14, but newer versions require Catalina or later for stability.
Processor: Universal binary supporting both Apple Silicon and Intel-based Mac computers.
Memory: No specific RAM requirements; runs well on all standard Apple configurations.
Display: Minimum 1024×768 pixel resolution required.
Hard Disk Space: Approximately 530 MB required.
Network: Same internet connection requirements as Windows version for license validation.
How to Install GraphPad Prism 10.6.0 Enterprise
Windows Installation Guide
Step 1: Prepare for Installation
-
Ensure your system meets the Windows requirements listed above
-
Close any running antivirus software temporarily to prevent interference
-
Download the Prism 10.6.0 .msi installation package from the official GraphPad website
Step 2: Run the Installer
-
Double-click the .msi file to launch the installation wizard
-
If prompted, select “Run as administrator” to ensure proper permissions
-
Choose the installation directory (avoid using Chinese characters or special symbols in the path)
Step 3: Complete Installation
-
Follow the wizard instructions to complete the installation
-
Click “Install” and wait for the progress bar to complete
-
When prompted, click “Quit Prism” to exit the software after installation
Step 4: License Activation
-
Launch Prism and select “Serial Number (Machine Licenses)” for Enterprise activation
-
Enter your Enterprise serial number
-
A browser window will open to the registration page
-
Submit your Machine ID to receive an activation code
-
Paste the activation code, accept the license agreement, and click “Start Using Prism”
Mac Installation Guide
Step 1: Download and Prepare
-
Download the correct .dmg file for your Mac architecture (Apple Silicon or Intel)
-
Double-click the .dmg file to mount the disk image
Step 2: Install the Application
-
Drag the Prism application icon to the Applications folder
-
Wait for the copy process to complete
Step 3: Complete Activation
-
Launch Prism from the Applications folder
-
Enter your Enterprise serial number when prompted
-
Follow the browser-based registration process to obtain your activation code
-
Enter the activation code to complete the process
How to Use GraphPad Prism 10.6.0 for Data Analysis
Getting Started with Data Entry
Prism organizes data in tables with eight different formats to match analysis needs. Choosing the correct table type is essential for proper analysis.
Data Table Types:
-
XY tables for standard scatter, line, and bar graphs with continuous x-values
-
Column tables for comparing groups with one variable
-
Grouped tables for comparing data with two grouping variables
-
Contingency tables for categorical data analysis
-
Survival tables for time-to-event data
-
Multiple variable tables for datasets with many variables
-
Nested tables for hierarchical data structures
-
Parts-of-whole tables for composition analysis
Key Analysis Workflows
Statistical Analysis: Prism simplifies statistical testing with intuitive selection menus. Users can perform t-tests, one-way and two-way ANOVA, repeated measures ANOVA, nonparametric tests, and correlation analysis without writing code.
Curve Fitting: The software provides extensive nonlinear regression models specifically designed for biological and pharmacological data, including dose-response curves, enzyme kinetics, and growth curves.
Graph Customization: Prism offers extensive customization options for creating publication-ready graphs. Users can adjust colors, fonts, axis labels, and add annotations directly within the interface.
Enterprise-Specific Advanced Features
K-Means Clustering: Enterprise users can leverage the automatic cluster number selection feature. This tool analyzes data using 17 different methods and recommends the optimal number of clusters based on consensus.
Working with Large Datasets: Enterprise edition supports processing significantly larger datasets, with memory configuration determining capacity. For datasets exceeding 16 million data units, 16 GB of RAM is recommended.
Best Use Cases for GraphPad Prism 10.6.0 Enterprise
Academic Research: University researchers use Prism for statistical analysis and graph creation in scientific publications. The software’s intuitive interface makes it accessible to graduate students while offering depth for experienced researchers.
Pharmaceutical Development: Drug discovery scientists employ Prism for dose-response studies, enzyme kinetics, and pharmacokinetic/pharmacodynamic data analysis.
Clinical Research: Medical researchers use Prism for survival analysis, clinical trial data visualization, and epidemiological studies.
Biotechnology: Genomics and proteomics researchers analyze large expression datasets with Prism’s advanced clustering and statistical tools.
Advantages and Limitations of Prism 10.6.0 Enterprise
Advantages
User-Friendly Interface: Prism features an accessible design that allows scientists to perform complex analyses without learning coding languages.
Publication-Ready Graphics: The software generates high-quality, customizable graphs suitable for scientific journals and presentations.
Integrated Workflow: Users can manage data entry, analysis, and graph creation within a single application.
Enterprise-Specific Capabilities: Advanced clustering analysis, larger dataset support, and institutional licensing provide value for research organizations.
Cross-Platform Availability: Prism runs on both Windows and Mac operating systems.
Limitations
System Requirements: The software requires modern operating systems and adequate memory for large datasets.
Internet Dependency: License validation requires periodic internet connections, which may be challenging in network-restricted environments.
Cost: Enterprise licensing represents a significant investment for organizations.
Learning Curve: While accessible, the software offers extensive features that require time to master fully.
Alternatives to GraphPad Prism
Commercial Alternatives
IBM SPSS Statistics: A comprehensive statistical analysis package with extensive data management capabilities. SPSS offers advanced analytics but may present a steeper learning curve than Prism.
SAS: An enterprise-level analytics platform offering powerful statistical modeling. SAS is more complex and suited for larger organizations with dedicated data analysts.
OriginLab OriginPro: A scientific graphing and data analysis software similar to Prism. OriginPro offers robust plotting capabilities and supports more file formats.
Stata: A statistical software package particularly popular in economics and social sciences. Stata offers extensive statistical tests but may require more programming knowledge.
Open-Source and Free Alternatives
R with RStudio: A free, open-source programming language for statistical computing. R offers unlimited flexibility and is free but requires coding skills.
Python with Scientific Libraries: Free and increasingly popular for data science applications. Python offers extensive capabilities through libraries like SciPy, Pandas, and Matplotlib.
JASP: A free, open-source alternative to SPSS with a user-friendly interface. JASP provides Bayesian and frequentist analyses but has a smaller feature set than Prism.
Jamovi: A free, open-source statistical platform based on R with a modern interface. Jamovi offers accessible analysis but may lack some advanced features.
Frequently Asked Questions
Q: What are the main differences between GraphPad Prism Enterprise and Standard editions?
A: The Enterprise edition includes exclusive features such as automatic cluster number selection for K-means clustering, which uses a consensus metric across 17 methods to determine optimal cluster counts. Enterprise also supports larger institutional deployments with machine-based licensing.
Q: Can GraphPad Prism 10.6.0 run on ARM-based Windows devices?
A: While Prism does not natively support ARM chipsets, it can run on ARM-based Windows devices using x64 emulation, which is available in Windows 11. Performance may vary compared to native x64 systems.
Q: Does GraphPad Prism 10.6.0 require an internet connection to work?
A: Prism requires internet connection for initial license activation and periodic validation. It attempts to connect every 24 hours during use and must successfully connect at least once every 30 days to maintain license validity.
Q: What file formats does GraphPad Prism 10.6.0 support for export?
A: Prism 10.6 supports SVG format for scalable vector graphics exports, making it suitable for publication-quality figures. Other export formats include PDF, TIFF, PNG, JPEG, and EMF. For data, Prism can export to formats including Excel, CSV, and text.
Q: Which macOS versions are compatible with GraphPad Prism 10.6.0?
A: Prism 10.6.0 requires macOS X 10.15 (Catalina) or higher. While earlier 10.x versions may run on macOS 10.14, newer versions require Catalina or later for stability and support. The software runs natively on both Intel and Apple Silicon Macs.
Q: Is GraphPad Prism suitable for beginners in statistical analysis?
A: Prism is designed to be accessible to researchers without extensive statistical backgrounds. Its intuitive interface guides users through data organization, analysis selection, and graph creation. However, understanding basic statistical concepts remains important for interpreting results correctly.
Q: How does Prism handle large datasets?
A: Prism’s ability to handle large datasets depends on system memory. For datasets up to 2 million data units, 2 GB RAM is sufficient. Larger datasets require more memory: 4 GB for up to 8 million units, 8 GB for up to 16 million units, and 16 GB for datasets exceeding 16 million units.
Final Thoughts
GraphPad Prism 10.6.0 Enterprise represents a significant advancement in scientific data analysis and visualization software. The August 2025 release introduces powerful new features, particularly in the area of automated cluster analysis, while maintaining the intuitive, user-friendly approach that has made Prism a favorite among researchers in biological and medical sciences.
The Enterprise edition’s automatic cluster number selection feature demonstrates GraphPad’s commitment to making advanced statistical techniques accessible to working scientists. By removing the guesswork from determining optimal cluster counts, researchers can focus on interpreting results rather than debating analytical methodology.
For research organizations requiring robust statistical analysis capabilities with publication-quality visualization, GraphPad Prism 10.6.0 Enterprise offers an integrated solution. Its cross-platform support, expanded data handling capabilities, and advanced Enterprise-specific features make it suitable for academic institutions, pharmaceutical companies, and biotechnology firms.
The software’s reliance on periodic internet connectivity for license validation and its system requirements for adequate memory are considerations for organizations planning deployment. However, these requirements are typical of modern scientific software and ensure users receive the benefits of regular updates and support.
Whether conducting fundamental biological research, analyzing clinical trial data, or developing new pharmaceutical compounds, GraphPad Prism 10.6.0 Enterprise provides a comprehensive platform for scientific data analysis and visualization.