

Overview of the Software
Table of Contents
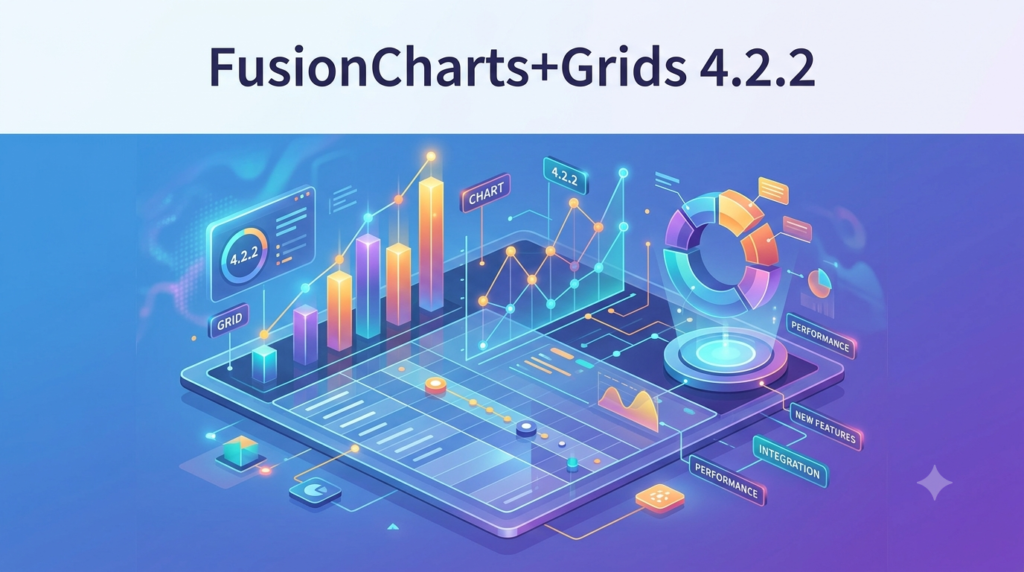
FusionCharts Grids is a JavaScript charting library that enables developers to create interactive charts, graphs, and maps for web and enterprise applications. Version 4.2.2 specifically focuses on enhancing the “Grids” functionality, which allows for advanced data table management. This feature enables users to view raw data alongside visual representations, making it easier to drill down into specifics without switching contexts.
The library supports a wide range of chart types, including 2D and 3D charts, gauges, and maps. Its architecture allows for seamless integration with popular frameworks like React, Angular, and Vue.js.
Key Features
-
Extensive Chart Library: Over 100 chart types, ranging from basic bar and line charts to advanced heat maps and radar charts.
-
Interactive Grids: The 4.2.2 iteration focuses on data grids that support sorting, filtering, and pagination, allowing users to manipulate data directly within the table.
-
Export Options: Users can export charts and data grids in multiple formats, including PNG, JPEG, SVG, and PDF.
-
Cross-Platform Compatibility: Works on all modern browsers and operating systems, including Windows, macOS, and Linux.
-
Seamless Framework Integration: Offers native plugins for React, Angular, Vue.js, and jQuery.
-
Real-time Data Streaming: Supports live data updates for dashboards requiring real-time analytics.
What’s New in Version 4.2.2
The update places a stronger emphasis on the “Grids” component, enhancing the data table user experience. Key improvements include:
-
Enhanced Grid Performance: Optimized rendering for large datasets to maintain responsiveness.
-
Customizable Column Templates: Allows developers to define custom render functions for specific columns, incorporating buttons, links, or status indicators.
-
Improved Accessibility: Better ARIA support and keyboard navigation for data grids, making them more accessible to users with disabilities.
-
Advanced Filtering Logic: Introduction of custom filter predicates and multi-column filtering for more complex data queries.
System Requirements
To run FusionCharts + Grids 4.2.2 efficiently, ensure your environment meets the following requirements:
-
Browsers: Chrome 60+, Firefox 60+, Safari 12+, Edge 79+.
-
JavaScript: ECMAScript 2015 (ES6) support required.
-
Server: Any server technology capable of serving static files (Node.js, Apache, Nginx).
-
Memory: Minimum 4GB RAM recommended for smooth rendering of complex dashboards.
Installation Guide
You can install FusionCharts + Grids 4.2.2 using multiple methods:
Via npm:
npm install fusioncharts
Via CDN:
Include the following scripts in your HTML file:
<!-- FusionCharts Core Library -->
<script src="https://cdn.fusioncharts.com/fusioncharts/latest/fusioncharts.js"></script>
<!-- FusionCharts Grids Plugin -->
<script src="https://cdn.fusioncharts.com/fusioncharts/latest/fusioncharts.grids.js"></script>
Manual Download:
-
Download the package from the official FusionCharts website.
-
Extract the files.
-
Copy the required JavaScript files to your project directory.
-
Reference them in your HTML using the
<script>tag.
How to Use the Software
A basic implementation involves creating a container for your chart and initializing the library:
-
Prepare the Data: Create an array containing your data points.
-
Create a Container: Add a
<div>element in your HTML with a specificid. -
Configure the Chart: Define the chart type, dimensions, and data source.
-
Render: Use the
new FusionCharts()constructor to render the instance.
Example:
const dataSource = {
    chart: {
        caption: "Sales Data",
        subcaption: "2024",
        xaxisname: "Month",
        yaxisname: "Revenue"
    },
    data: [
        { label: "Jan", value: "400" },
        { label: "Feb", value: "250" }
    ]
};
new FusionCharts({
    type: 'column2d',
    renderAt: 'chart-container',
    width: '100%',
    height: '400',
    dataFormat: 'json',
    dataSource
}).render();
Best Use Cases
FusionCharts + Grids 4.2.2 is suitable for various applications:
-
Enterprise Dashboards: Visualize key performance indicators (KPIs) for management.
-
Financial Reporting: Present complex financial data with drill-down capabilities.
-
Healthcare Analytics: Track patient data and hospital metrics.
-
E-commerce Analytics: Monitor sales, inventory, and customer behavior.
-
Educational Platforms: Display student performance and institutional statistics.
Advantages and Limitations
Advantages:
-
Rich Ecosystem: Hundreds of charts and maps available out-of-the-box.
-
Strong Documentation: Comprehensive API references and examples.
-
Community Support: A large community of developers and active forums.
Limitations:
-
Cost: Licensing can be expensive for enterprise solutions.
-
Learning Curve: Advanced customizations may require deep JavaScript knowledge.
-
Customization Constraints: Some complex chart types may have limitations in styling.
Alternatives to the Software
Consider these alternatives based on your specific needs:
-
Chart.js: Open-source, lightweight, and ideal for simple visualizations.
-
D3.js: Provides maximum flexibility and control but requires more effort.
-
Highcharts: Offers similar features, but with a different licensing model.
-
Google Charts: Free and reliable for common chart types.
Frequently Asked Questions
-
Is FusionCharts free to use?
FusionCharts offers a free trial, but commercial use requires a paid license. -
Can I use FusionCharts with React?
Yes, FusionCharts provides official React wrappers for integration. -
What is the difference between FusionCharts and FusionCharts + Grids?
The + Grids version includes dedicated grid/table rendering capabilities. -
How do I export a chart?
Use theexportChart()method to export in PNG, JPEG, or SVG format. -
Can I visualize real-time data?
Yes, it supports data streaming for real-time dashboards.
Final Thoughts
FusionCharts + Grids 4.2.2 is a robust solution for developers needing to implement data visualization quickly. The enhanced grid feature makes it a compelling choice for applications where data tables and charts coexist. By understanding its features and limitations, you can determine if it aligns with your project’s requirements while adhering to all licensing obligations.
Our Paid Service
“We do not sell or provide any software. We only offer professional support services. If any software on your system is not working properly, or you are facing installation errors, crashes, or any other technical issue — just contact us. We will help you fix the problem quickly and remotely via AnyDesk. No software will be provided from our side — only expert troubleshooting and support.”


